Pishi Reloaded: Binary only address sanitizer for macOS KEXT.
In the part 1 of my tutorial style blog post about fuzzing, I discussed how we can instrument the macOS KEXTs to collect code coverage at the basic block or edge level.
We talked about Coverage-guided fuzzing which uses code coverage as a metric to direct the fuzzer.
However, a fuzzer also requires additional feedback from the target to determine if it has discovered a vulnerability. Almost all fuzzers rely on crashes, panics, or BSODs as indicators.
Fuzzers send inputs to a program and monitor it for segmentation faults or crashes. A segmentation fault typically indicates a bug or vulnerability.
Not only fault detection has always been a challenge and a subject of study in fuzzing, and as lcamtuf tells, one of the most labor-intensive portions of any fuzzing project is the work needed to determine if a particular crash poses a security risk.
In the second part of the series, I plan to discuss about memory error detectors or sanitizer which are tools and methods to increase the likelihood of triggering a crash in the case of a bug or vulnerability and our approach to implementing a binary-only address sanitizer for macOS KEXT. I also presneted this project at zer0con2025.
XNU has a KASAN build (will describe this later) in KDK, or even you can build a KASAN version of it, but KEXTs are not included. So, whenever you fuzz a KEXT, a vulnerability may go unnoticed. This is why I decided to work on this project.
It’s important to note that a panic is not the only sign of a vulnerability, for example, Mateusz Jurczyk and Gynvael Coldwind have demonstrated that memory access patterns can be used to identify double-fetch kernel vulnerabilities.
Vulnerabilities are sneaky
Imagine there is a Use after free or a Heap buffer overflow two common memory safety vulnerabilities in C and C++,
and your fuzzer has reached the vulnerable code, but if nothing happens after triggering the vulnerability (e.g., no crash), the fuzzer won’t be notified and won’t save the generated input.
// Use after free
int main(int argc, char **argv) {
  int *array = new int[100];
  delete [] array;
  return array[argc]; // UAF, but no crash.
}
// Heap buffer overflow
int main(int argc, char **argv) {
int *array = new int[100];
array[0] = 0;
int res = array[argc + 100]; // overflow, but no crash.
delete [] array;
return res;
}A segmentation fault can happen for many reasons, such as attempting to access a nonexistent memory address or trying to access memory with improper permission. However, this is not the case for many triggered bugs. for example, freed memory is just another accessible chunk of the heap that returns to the heap manager. If you allocate a new heap chunk, it’s part of a larger memory block managed by the heap manager( memory managers usually allocate one or more pages and splits them into chunks.) so overflowing into it won’t be noticeable at the time of write, unless later another part of the code is using the corrupted buffer.
To trigger a crash, you need to be lucky, for instance, if the index of an array is controllable by an attacker, a segmentation fault will only occur if the index is big enough. for example, in a buffer with size of 10, accessing buf[0x10000] may cause a crash, but buf[15] will not.
For the same reason, years ago I had implemented my own tool to increase the likelihood of kernel panic in case of triggering a UAF in Windows kernel heap.
A final note about crashes is that not all aborts or synchronous Exceptions indicate a vulnerability( sometimes the exception handling has a vulnerability). If you check the Arm64’s Exception Syndrome Register, you’ll see many exceptions that do not point to an actual vulnerability. for example, divide by zero or unlike before a null pointer dereference, is not necessarily a sign of a vulnerability, unless it may be a side effect of some overflow. as I mentioned before one of the most labor-intensive portions of any fuzzing project is the work needed to determine if a particular crash poses a security risk. Microsoft even developed the !exploitable Crash Analyzer to help save time on identifying vulnerabilities.
An example in the ARM64 world a PAC authentication failure panic, which might initially seem like an exploitable bug. but it could actually be a null pointer dereference. I highly recommend reading sleh_synchronous function in sleh.c file of XNU.
Traces of an Old Time
More than 15 years ago, I started using Driver Verifier as the first tool to detect memory corruption in the Windows kernel to enable special kernel pool.
When special pool is enabled, the memory allocation function ExAllocatePoolWithTag and the corresponding free function ExFreePoolWithTag will use MmAllocateSpecialPool and MmFreeSpecialPool, respectively.
Each memory allocation requested by the driver is placed on a separate page.
The highest possible address that allows the allocation to fit on the page is returned,
so that the memory is aligned with the end of the page. The previous portion of the page is written with special patterns.
The previous page and the next page are marked inaccessible.
We will get a BSOD if the driver reads or writes to the buffer after freeing it or If the driver attempts to access memory after the end of the allocation.
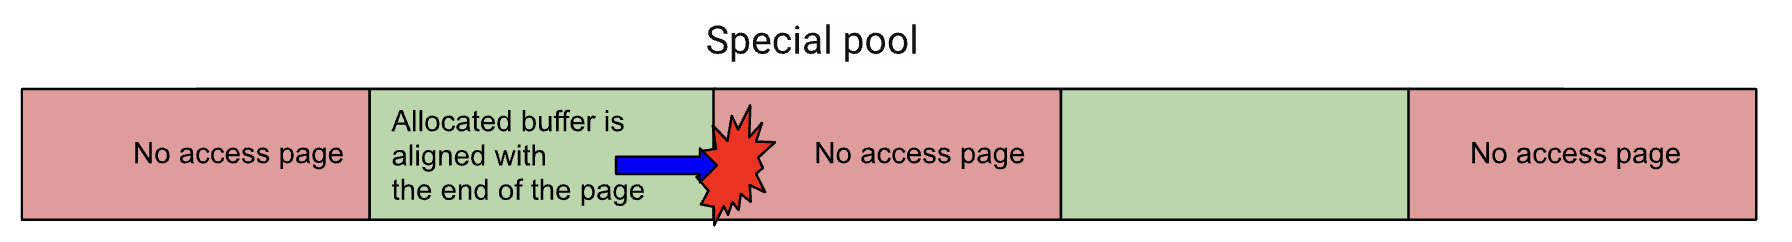
The good side of special pool is that it works for closed-source kernel modules, but the bad side is that it has very poor efficiency, because each allocation from the special pool uses one page.
Using virtual memory and paging is very common method to detect Vulnerabilities in closed source binaries.
PageHeap in Windows and libgmalloc in macOS, according to its man page also employs same technique to detect heap memory related Vulnerabilities in user space.
libgmalloc is used in place of the standard system malloc, and uses the virtual memory system to identify memory access bugs.  Each malloc allocation is placed on its own virtual memory page (or pages). By default, the returned
address for the allocation is positioned such that the end of the allocated buffer is at the end of the last page, and the next page after that is kept unallocated.  Thus, accesses beyond the end of the buffer cause a bad access error
immediately.  When memory is freed, libgmalloc deallocates its virtual memory, so reads or writes to the freed buffer cause a bad access error.  Bugs which had been difficult to isolate become immediately obvious, and you'll know
exactly which code is causing the problem.
Using virtual memory and dedicated a page for each allocation doesn’t need to instrument memory read or write instructions and there is no need to have source code of the system under test,
there are many more methods to detect memory corruptions, which we discuss some of them in the following parts.
Shadow memory and Valgrind
Although using Pages to detect vulnerabilities is simple to implement, it does not support many types of vulnerabilities. Another method to detect memory vulnerabilities in closed source binaries is to rewrite them in order to instrument every read or write instruction which verifies them with Shadow memory.
Shadow memory is a technique where a parallel memory space is used to track additional information about a program’s memory, such as initialization or access status. It helps detect issues like memory corruption, uninitialized memory access, There is a one-to-one relationship between the shadow memory and the main application memory.
Valgrind is one of the first and most well-known implementations of this method. Valgrind first translates the program into a temporary, intermediate representation (IR). After the conversion, it can instrument or perform whatever transformations it wants to make on the IR, such as inserting extra instrumentation code around almost all memory read or write instructions. Then, at each instrumentation point, it checks if the memory access is safe or not(poisoned) with the help of the metadata stored in the shadow memory.
Valgrind also implement its own free and alloc functions to update the metadata in the Shadow memory.
Shadow memory with exception handling.
BoKASAN paper offers another binary-level method to validate memory access. It uses shadow memory, similar to Valgrind, but instead of rewriting the kernel module binary, it hooks into the kernel’s page fault and debug exception handlers to monitor memory access. When a sanitized memory region is accessed, a page fault occurs due to the unset present bit, triggering the page fault handler. The handler checks the memory address validity via shadow memory and raises a kernel panic for invalid accesses. If valid, the instruction is single-stepped with the present bit temporarily set. After execution, the present bit is cleared to trap future accesses. BoKASAN applies selective sanitization by registering target processes and checking for sanitization during memory allocation. Registered processes undergo sanitization, while others receive default allocation. Allocation. BoKASAN hooks the memory allocation functions (e.g., kmalloc) to allocate the object and creating a red zone then initializes the shadow memory.
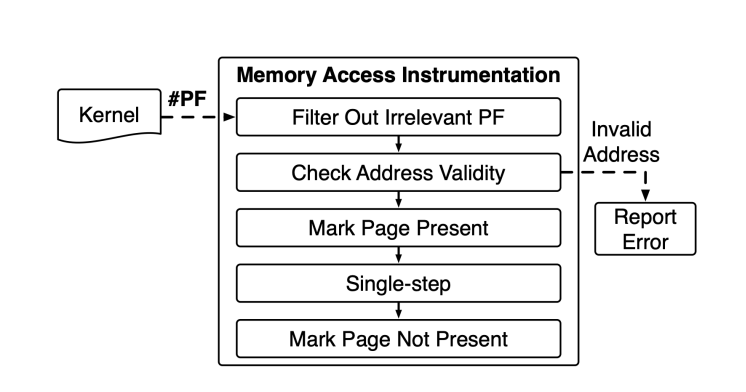
Using an exception handler for every memory access would consume a significant amount of CPU time, making it neither efficient nor a good approach.
LLVM and AddressSanitizer
When we have access to the source code, we can use AddressSanitizer (ASAN), a widely used memory vulnerability detector that combines shadow memory with source code-level instrumentation. ASAN leverages LLVM to instrument every memory read and write operation and introduces its own runtime library for memory allocation and deallocation (such as malloc/free). At these instrumented points, ASAN checks memory access by comparing it to the corresponding shadow memory.
The run-time library replaces malloc, free and related functions, whenever memory is allocated, additional memory is reserved beyond the requested block as a poisoned redzones(It means the metadata for this address in shadow memory is labeled as inaccessible.) around allocated heap regions, and it delays the reuse of freed heap regions, if a memory read or write operation overflows into the adjacent chunk, i.e, poisoned redzones, KASAN detects the violation at the time of read or write after verifying metadata, and reports it as a bug.
Our target is the kernel, so let’s talk about all three KASAN modes in Linux kernel and how the macOS kernel also implements its own version of it.
Generic or Software KASAN
As described on the KASAN page of the Linux kernel, Software KASAN modes use shadow memory to record whether each byte of memory is safe to access. It also uses compile-time instrumentation to insert shadow memory checks before each memory access.
Generic KASAN dedicates 1/8th of kernel memory to its shadow memory (16TB to cover 128TB on x86_64) and uses direct mapping with a scale and offset to translate a memory address to its corresponding shadow address.
For each memory access or write, the compiler calls the following functions to check the validity of the accessed memory.
based on the size of read or write N will be 2, 4, 8 and 16.
void __asan_storeN(unsigned long addr, size_t size)
{
	check_memory_region(addr, size, true);
}
Which checks the shadow memory to check if the destination memory is poisoned or not.
static __always_inline void check_memory_region(unsigned long addr,
						size_t size, bool write)
{
	if (unlikely(size == 0))
		return;
	if (unlikely((void *)addr <
		kasan_shadow_to_mem((void *)KASAN_SHADOW_START))) {
		kasan_report(addr, size, write, _RET_IP_);
		return;
	}
	if (likely(!memory_is_poisoned(addr, size)))
		return;
	kasan_report(addr, size, write, _RET_IP_);
}
The memory_is_poisoned_1 function uses kasan_mem_to_shadow to locate the corresponding byte in the shadow memory. It then checks the metadata to determine if the memory is addressable. If the metadata indicates that the memory is addressable, the execution continues normally. However, if the memory is not addressable, it implies that the execution is attempting to access memory that it should not, indicating a potential memory corruption or violation.
static __always_inline bool memory_is_poisoned_1(unsigned long addr)
{
	s8 shadow_value = *(s8 *)kasan_mem_to_shadow((void *)addr);
	if (unlikely(shadow_value)) {
		s8 last_accessible_byte = addr & KASAN_SHADOW_MASK;
		return unlikely(last_accessible_byte >= shadow_value);
	}
	return false;
}
static inline void *kasan_mem_to_shadow(const void *addr)
{
return (void *)((unsigned long)addr >> KASAN_SHADOW_SCALE_SHIFT)
+ KASAN_SHADOW_OFFSET;
}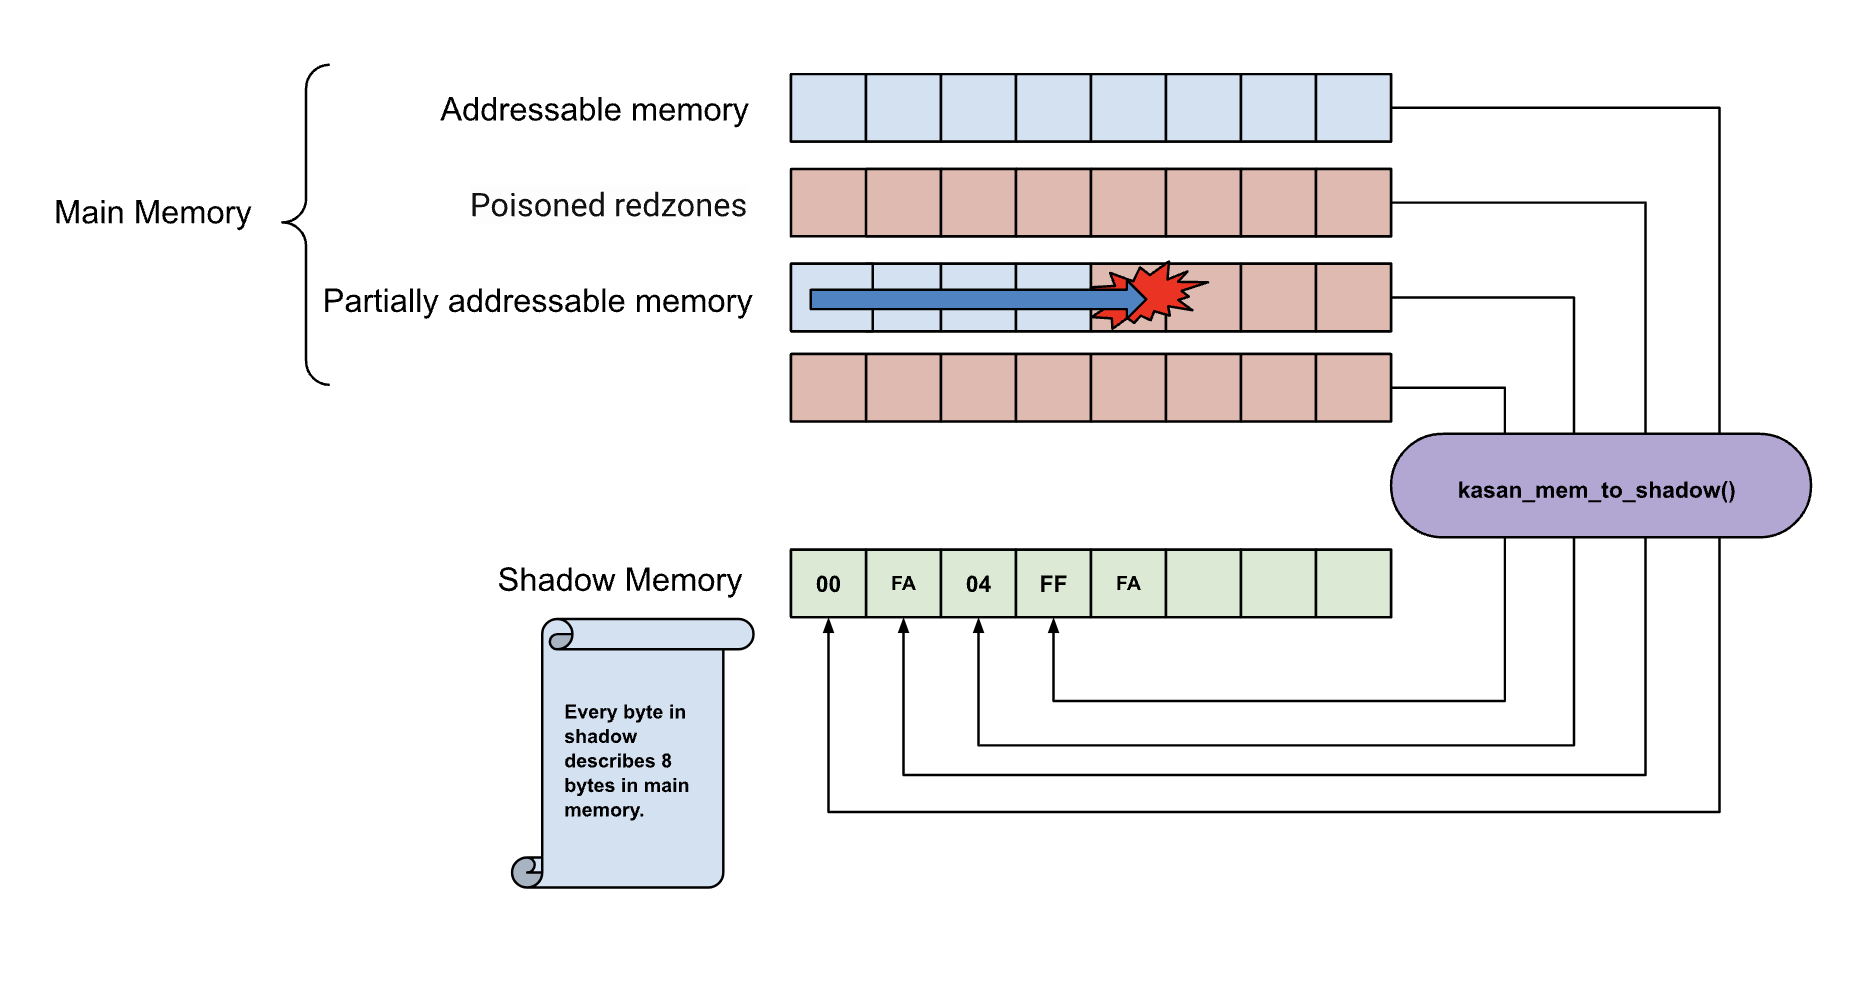 As I mentioned, each byte in the shadow memory represents 8 bytes in the main memory. It can precisely indicate how many bytes are addressable, or if the memory is within a redzone.
If the shadow byte is 00, it means all 8 bytes are accessible. If the shadow byte is 01, 02, 03, 04, 05, 06, or 07, it means that the corresponding number of bytes (01, 02, 03, 04, 05, 06, or 07) are accessible.
As I mentioned, each byte in the shadow memory represents 8 bytes in the main memory. It can precisely indicate how many bytes are addressable, or if the memory is within a redzone.
If the shadow byte is 00, it means all 8 bytes are accessible. If the shadow byte is 01, 02, 03, 04, 05, 06, or 07, it means that the corresponding number of bytes (01, 02, 03, 04, 05, 06, or 07) are accessible.
Shadow byte legend (one shadow byte represents 8 application bytes):
 Addressable:           00
 Partially addressable: 01 02 03 04 05 06 07
 Heap left redzone:       fa
 Freed heap region:       fd
 Stack left redzone:      f1
 Stack mid redzone:       f2
 Stack right redzone:     f3
 Stack after return:      f5
 Stack use after scope:   f8
 Global redzone:          f9
 Global init order:       f6
 Poisoned by user:        f7
 Container overflow:      fc
 Array cookie:            ac
 Intra object redzone:    bb
 ASan internal:           fe
 Left alloca redzone:     ca
 Right alloca redzone:    cb
Let’s see a real output of disassembled memory access in AddressSanitizer.
int a = 0;
int* b = &a;
*b = 0x41;
If we instrument above code with AddressSanitizer, it will be translated into the following code. Note that all the above functions are inlined for performance reasons.
  local_38 = puVar2;
  bVar3 = *(byte *)(((ulong)puVar2 >> 3) + 0x1000000000);
  local_94 = (uint)bVar3;
  if ((local_94 != 0) &&
     (iVar1 = (int)(char)(((byte)puVar2 & 7) + 3), iVar4 = (char)bVar3 - iVar1,
     iVar4 == 0 || (char)bVar3 < iVar1)) {
    __asan_report_store4(iVar4,puVar2);
  }
  *(undefined4 *)puVar2 = 0x41;
As I mentioned before, allocation functions update the shadow memory, and when you free memory, it also updates the shadow memory to indicate that the memory is free.
The software-based AddressSanitizer (ASan) verifies memory at a byte granularity, the compiler also inserts readzones around stack and global variables to be able to detect violations around them. For more detailed information, you can refer to the following resources,
AddressSanitizerAlgorithm here and its original paper
ASAN is very fast. The average slowdown of the instrumented program is ~2x and it can detect almost all memory related violations
- Use after free (dangling pointer dereference)
- Heap buffer overflow
- Stack buffer overflow
- Global buffer overflow
- Use after return
- Use after scope
- Initialization order bugs
- Memory leaks
One known issue is that it cannot detect certain bugs. For instance, a memory access might end up in second array, which has a valid addressable flag in the shadow memory. This is an issue with shadow memory but not with tagging, which I will describe in the next part.
char *first = new char[100];
char *second = new char[1000];
a[500] = 0;
Software Tag-Based KASAN
64-bit ARM processors only use part of the 64-bit address space for virtual addresses.
All Armv8-A implementations support 48-bit virtual addresses. Number of address bits of virtual addresses depends on the memory addressing scheme
of TCR_EL1, Number of bits of the virtual address space can be expressed as 64 - TCR_EL1.TnSZ
For example, if TCR_EL1.T1SZ is set to 32, the size of the kernel region in the EL1 virtual address space is 2^32 bytes (0xFFFF_FFFF_0000_0000 to 0xFFFF_FFFF_FFFF_FFFF). Any access to an address that is outside of the configured ranges will generate an exception or translation fault.
TnSZ and TGn, i.e., the granule size for the TTBRn region, are two of the most important parts of the memory schema of VMSAv8-64.
I would like to mention that XNU also uses T1SZ, along with E0PD( check locore.s) as part of its Meltdown/Spectre mitigations(search for __ARM_KERNEL_PROTECT__ in XNU to see how other parts of the kernel have been modified for kernel protection against potential architectural or microarchitectural vulnerabilities.).
Translation Control Register is part of the virtual memory control register functional group that controls the configuration of memory translation tables and address translation in the Arm64.
/*
 * Translation Control Register (TCR)
 * Current (with 16KB granule support):
 *
 *  63  39   38   37 36   34 32    30 29 28 27 26 25 24   23 22 21  16    14 13 12 11 10 9   8    7   5  0
 * +------+----+----+--+-+-----+-----+-----+-----+-----+----+--+------+-----+-----+-----+-----+----+-+----+
 * | zero |TBI1|TBI0|AS|z| IPS | TG1 | SH1 |ORGN1|IRGN1|EPD1|A1| T1SZ | TG0 | SH0 |ORGN0|IRGN0|EPD0|z|T0SZ|
 * +------+----+----+--+-+-----+-----+-----+-----+-----+----+--+------+-----+-----+-----+-----+----+-+----+
 *
 * TBI1:  Top Byte Ignored for TTBR1 region
 * TBI0:  Top Byte Ignored for TTBR0 region
 * T0SZ:  Virtual address size for TTBR0
 * T1SZ:  Virtual address size for TTBR1
 */
From list of bits in the TCR two of them are important for us.
- TBI1: Top Byte Ignored for
TTBR1region - TBI0: Top Byte Ignored for
TTBR0region
Top Byte Ignored bit configures CPU to ignore top byte of virtual addresses.
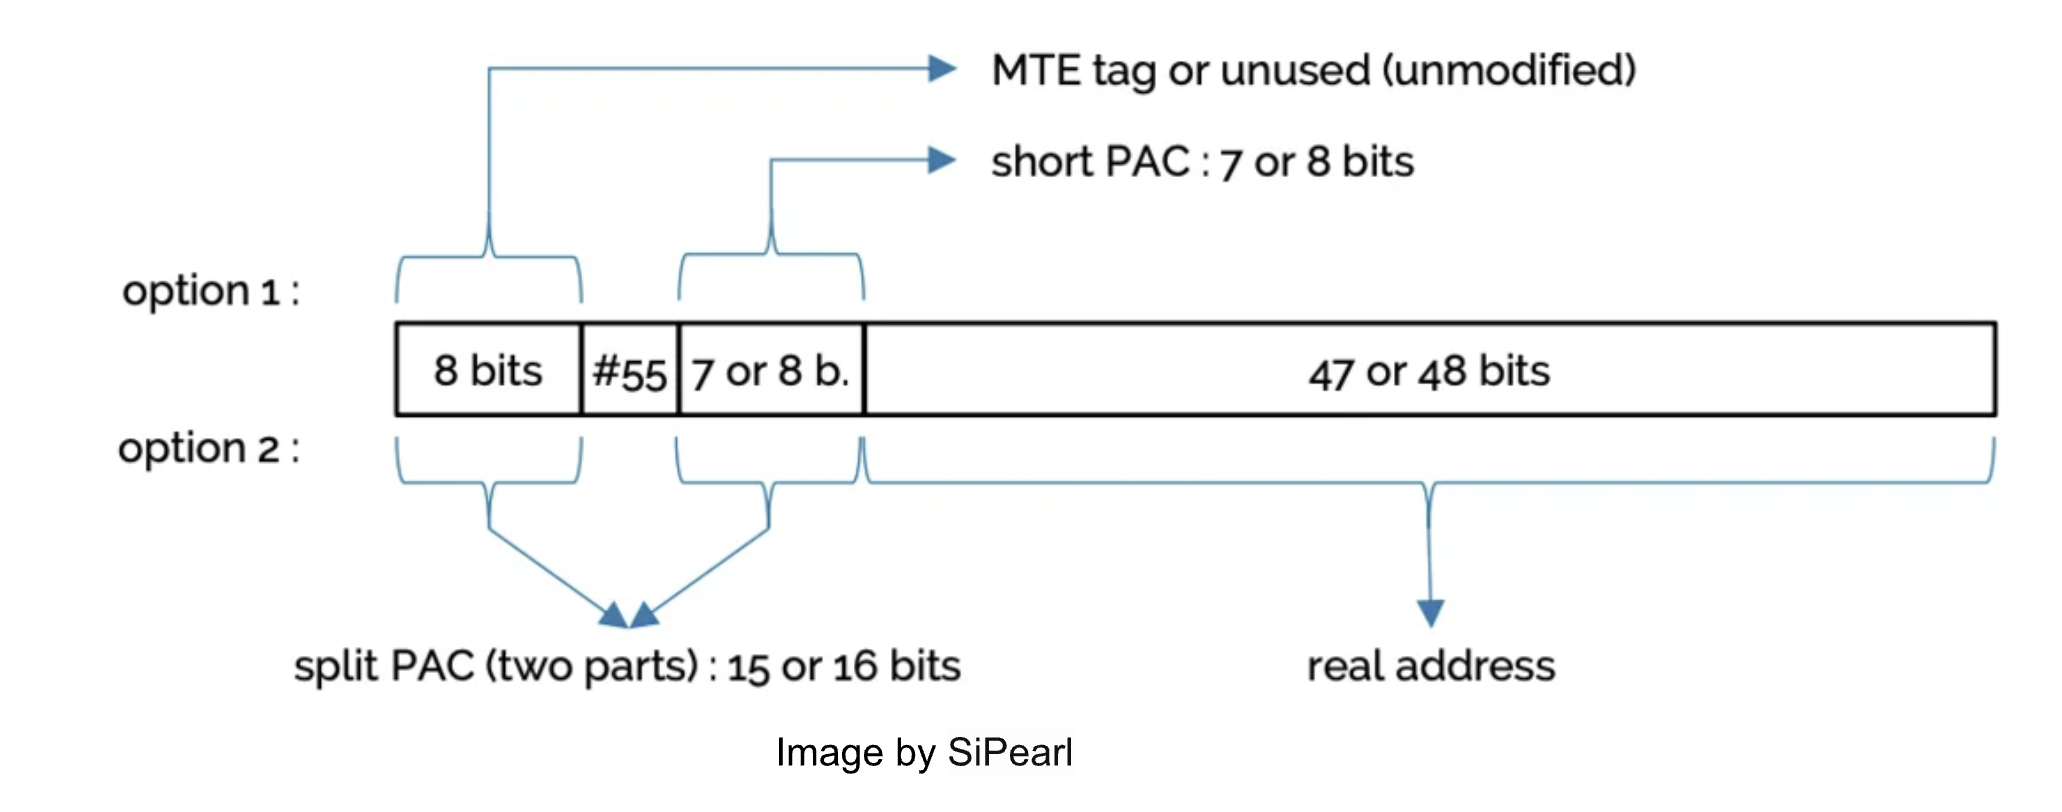
This one byte is used to tag the address, this byte is exactly what is used in Arm’s Memory Tagging Extension, except in MTE it does use dedicated hardware storage for tags.
The size of the PAC also depends on whether pointer tagging is enabled or not, The PAC is stored in the remaining unused bits of the pointer. SiPearl’s white paper about CFI on Arm64 very clearly explains how virtual address works regarding to TBI and PAC. (image by SiPearl’s White Paper)
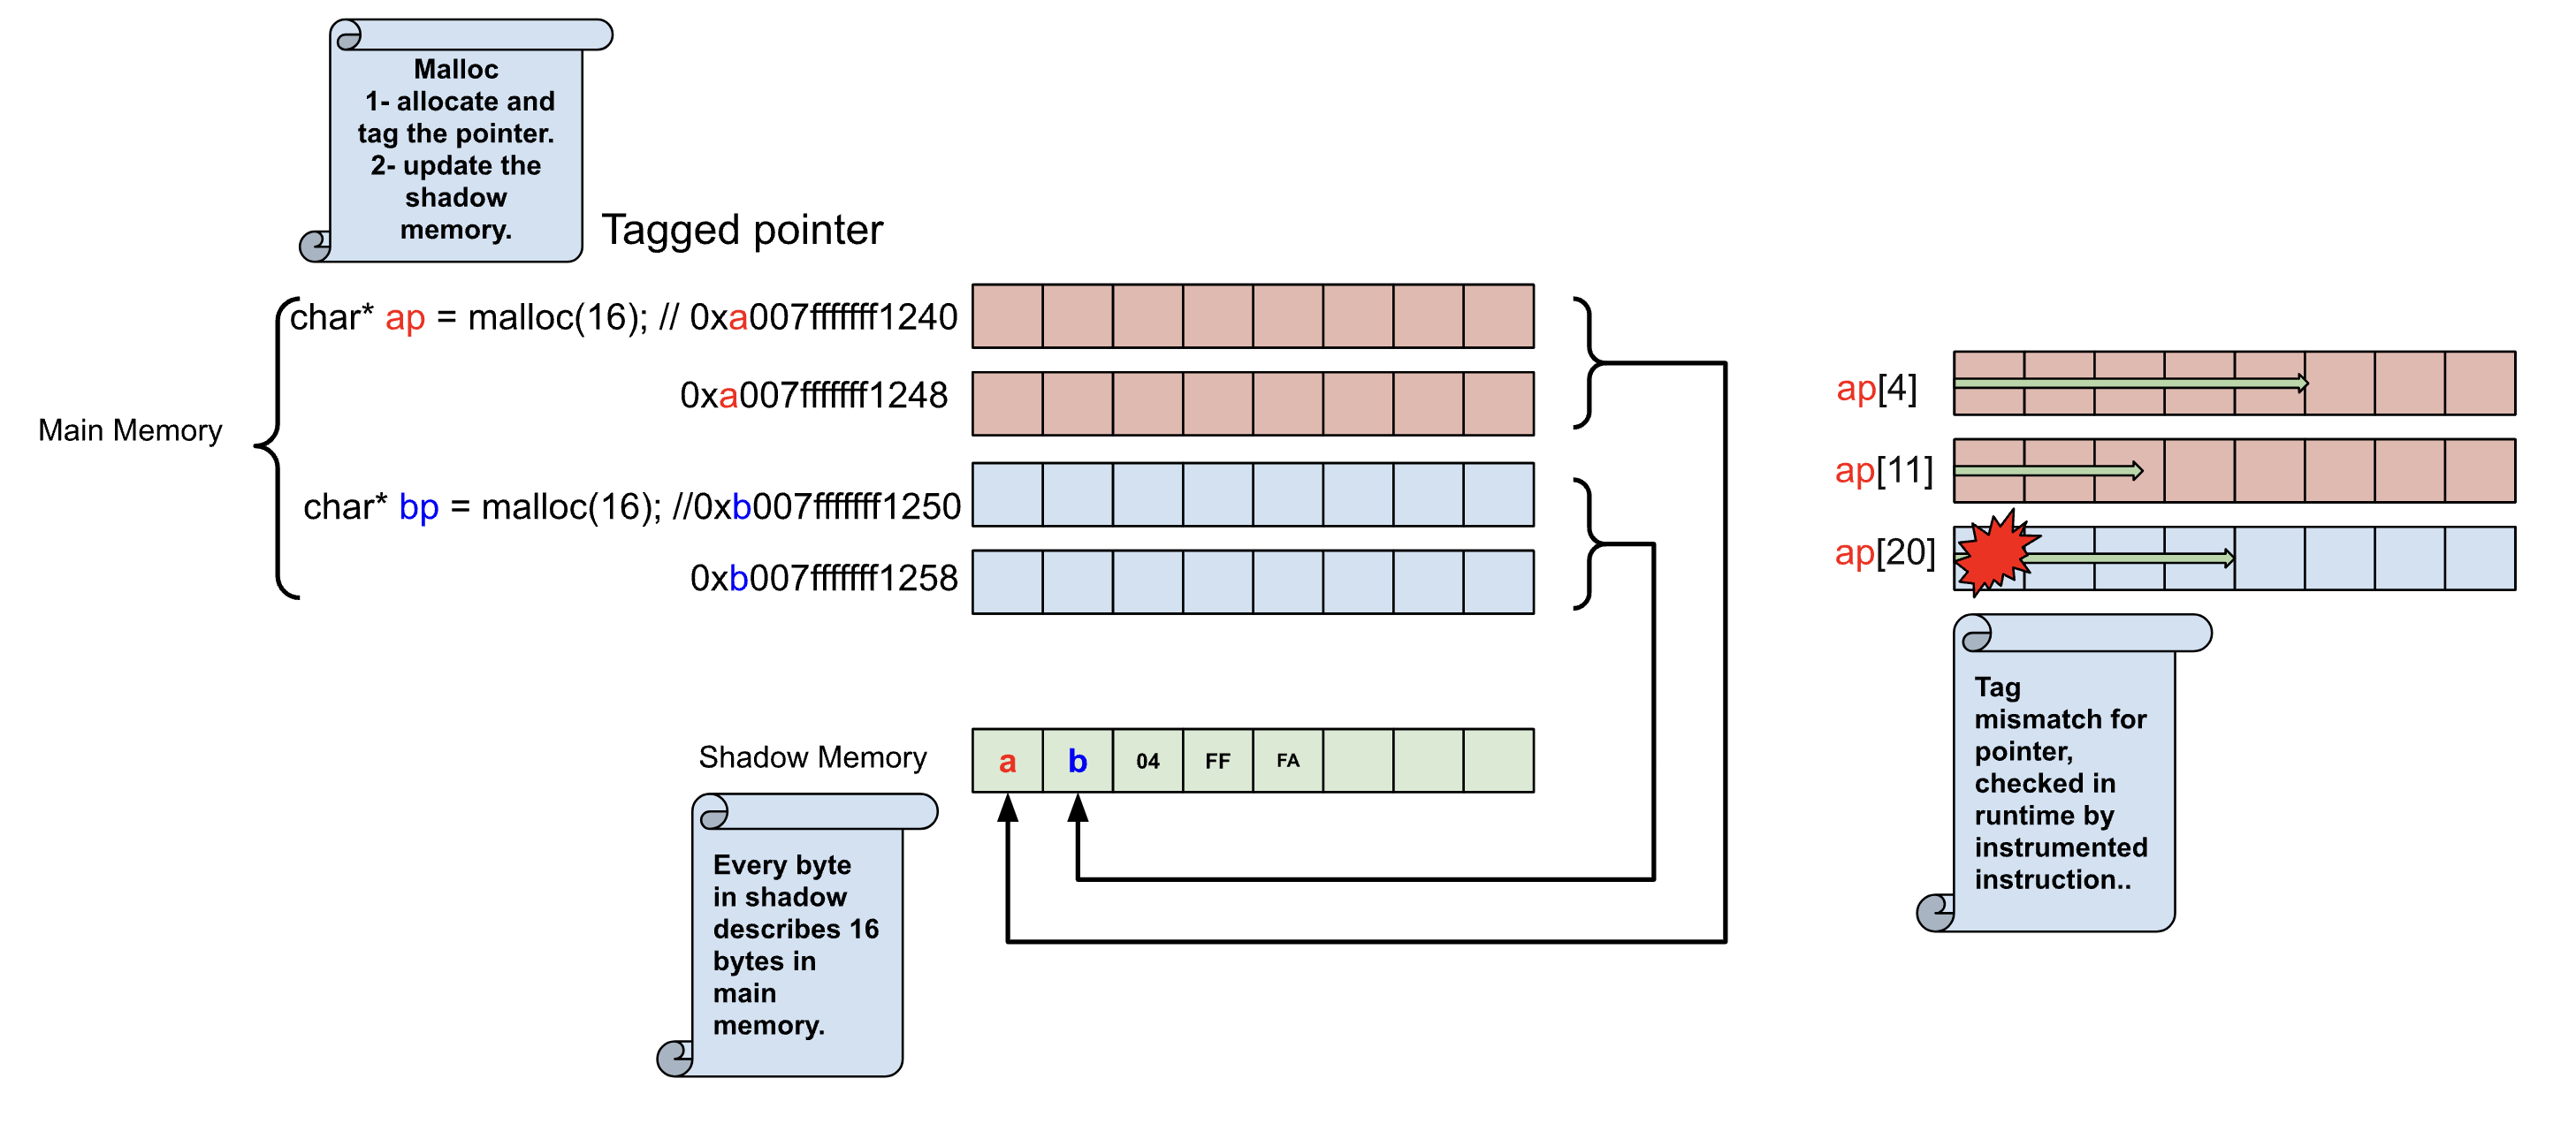
Software Tag-Based KASAN utilizes the Top Byte Ignore (TBI) feature of arm64 CPUs to store a pointer tag in the top byte of kernel pointers. Additionally, it uses shadow memory to associate memory tags with each 16-byte memory cell, reserving 1/16th of the kernel memory for this purpose.
When memory is allocated, Software Tag-Based KASAN generates a random tag, assigns it to the allocated memory, and embeds the same tag in the returned pointer.
The kernel build system like previous method employs LLVM’s compile-time instrumentation to insert checks before every memory access. These checks ensure that the tag of the accessed memory matches the tag of the pointer being used. If there is a tag mismatch, Software Tag-Based KASAN reports a bug.
Software Tag-Based KASAN uses 0xFF as a match-all pointer tag (accesses through pointers with the 0xFF pointer tag are not checked).
XNU implements both Classic KASAN and Software Tag-Based KASAN in kasan-tbi.c
a comment in kasan.c elegantly describes how it has been implemented tag-based sanitizer.
For each 16-byte granule in the address space, one byte is reserved in the
shadow table. TBI (Top Byte Ignore) is used to associate a tag to each
VA pointer and to match it with the shadow table backing storage. This
mode of operation is similar to hardware memory tagging solutions (e.g. MTE)
and is not available on x86-64. Cost: ~8% of memory. No need for redzones
or quarantines. See kasan-tbi.c for details.
Using a software-based tag consumes less memory because it doesn’t rely on redzones or quarantines to detect violations. However, it has a 16-byte granularity, meaning it can only detect overflows if they exceed 16 bytes, unless partial addressing is supported( described at the last section).
uint8_t *allocated_mem = ( uint8_t *)IOMalloc(4);
allocated_mem[10]; // this is an overflow but tag based KASAN can't detect it.
The arm_init function of XNU executes once on the boot CPU upon entry from iBoot. It then calls arm_setup_pre_sign, which subsequently invokes arm_set_kernel_tbi.
/*
 *	Routine:	arm_setup_pre_sign
 *	Function:	Perform HW initialization that must happen ahead of the first PAC sign
 *			operation.
 */
static void
arm_setup_pre_sign(void)
{
#if __arm64__
	/* DATA TBI, if enabled, affects the number of VA bits that contain the signature */
	arm_set_kernel_tbi();
#endif /* __arm64 */
}
If you build a KASAN-enabled version of XNU for an ARM SoC the CONFIG_KERNEL_TBI preprocessor set will be defined. In this case, the arm_set_kernel_tbi function will configure the TBI (Top-Byte Ignore).
/*
 * TBI (top-byte ignore) is an ARMv8 feature for ignoring the top 8 bits of
 * address accesses. It can be enabled separately for TTBR0 (user) and
 * TTBR1 (kernel).
 */
void
arm_set_kernel_tbi(void)
{
#if !__ARM_KERNEL_PROTECT__ && CONFIG_KERNEL_TBI
	uint64_t old_tcr, new_tcr;

	old_tcr = new_tcr = get_tcr();
	/*
	 * For kernel configurations that require TBI support on
	 * PAC systems, we enable DATA TBI only.
	 */
	new_tcr |= TCR_TBI1_TOPBYTE_IGNORED;
	new_tcr |= TCR_TBID1_ENABLE;

	if (old_tcr != new_tcr) {
		set_tcr(new_tcr);
		sysreg_restore.tcr_el1 = new_tcr;
	}
#endif /* !__ARM_KERNEL_PROTECT__ && CONFIG_KERNEL_TBI */
}
with CONFIG_KERNEL_TBI preprocessor that memory allocation functions like zalloc, kalloc (including kalloc_type and kalloc_data) also tag the pointer upon allocation and update the shadow table with proper flags in the vm_memtag_set_tag function.
XNU sets up the shadow memory in arm_vm_init for KASAN builds, which end up calling kasan_arm64_pte_map
#if KASAN
	/* record the extent of the physmap */
	physmap_vbase = physmap_base;
	physmap_vtop = physmap_end;
	kasan_init();
#endif /* KASAN */
kasan_arm_pte_map() is the heart of the arch-specific handling of the shadow table. It walks the existing page tables that map shadow ranges and allocates/creates valid entries as required.
At this point, everything required to have a working software tag-based KASAN is described, Pointer tagging while allocating memory,
Shadow memory mapping in the Page table at boot time and read/write instrumentation of instructions to check the tag and verify if it matches the shadow memory, which happens in the build time with help of LLVM and only for XNU.
Based on this knowledge, I aimed to implement all these ideas (e.g., enabling TBI, allocating shadow memory, and tagging pointers during allocations by hooking memory allocate functions) in my KEXT.
 However, I remembered that we have the KASAN build of the kernel in the KDK. why not using it?
I booted the KASAN kernel with my KEXT, allocated some memory using
However, I remembered that we have the KASAN build of the kernel in the KDK. why not using it?
I booted the KASAN kernel with my KEXT, allocated some memory using IOMalloc and IOMallocData, and applied the same logic to locate the shadow memory and verify the tag. unsurprisingly, it worked as expected.
void check_kasan(uint8_t *address)
{
  int8_t pointer_tag = (uint8_t)((uintptr_t)address >> 56);
  uint8_t memory_tag = *(uint8_t *)(((((uintptr_t)address) | 0xFF00000000000000ULL) >> 4) + 0xF000000000000000ULL);

  if ((pointer_tag != memory_tag) && (pointer_tag != 0xFF)) {
      printf("[Pishi] Overflow panic\n");
      //  asm ("brk 0x0");
  }
}

void test_heap_overflow()
{
  uint8_t *allocated_mem = ( uint8_t *)IOMalloc(16);//IOMallocData(16);
  if (!allocated_mem)
    return ;

  check_kasan(allocated_mem); // tag matches
  check_kasan(allocated_mem + 17); // detect overflow
  IOFree(allocated_mem, 16);
  check_kasan(allocated_mem); // detect UAF
  return;

}
Shadow for address
I’d like to have a brief discussion about shadow mapping in XNU and LLVM to better understand our check_kasan function and learn how LLVM handles instrumentation.
We know the pointer tag is on the top byte of the pointer so we can extract it by shifting the address to right by 56 bits.
uint8_t pointer_tag = (uint8_t)((uintptr_t)address >> 56);but what are the following numbers and why we are shifting and doing bitwise or operation.
uint8_t memory_tag = *(uint8_t *)(((((uintptr_t)address) | 0xFF00000000000000ULL) >> 4) + 0xF000000000000000ULL);In XNU, the SHADOW_FOR_ADDRESS macro is used to map an address to shadow memory, which expands to the following preprocessor directives.
#define VM_KERNEL_STRIP_PAC(_v) (ptrauth_strip((void *)(uintptr_t)(_v), ptrauth_key_asia))
#define VM_KERNEL_STRIP_TAG(_v)         (vm_memtag_canonicalize_address((vm_offset_t)_v))
#define VM_KERNEL_STRIP_PTR(_va)        ((VM_KERNEL_STRIP_TAG(VM_KERNEL_STRIP_PAC((_va)))))
#define VM_KERNEL_STRIP_UPTR(_va)       ((vm_address_t)VM_KERNEL_STRIP_PTR((uintptr_t)(_va)))
#define KASAN_STRIP_ADDR(_x)    (VM_KERNEL_STRIP_UPTR(_x))
#define SHADOW_FOR_ADDRESS(x) (uint8_t *)(((KASAN_STRIP_ADDR(x)) >> KASAN_SCALE) + KASAN_OFFSET)
KASAN_SCALE and KASAN_OFFSET are defined at the build time.
As you see in The disassembled code of kasan_tbi_get_tag_address, It untags the pointer, removes the PAC, and then performs the mapping to shadow memory.VM_KERNEL_STRIP_PAC emits xpaci instruction which strips the Pointer Authentication Code.
uint8_t *
kasan_tbi_get_tag_address(vm_offset_t address)
{
	return SHADOW_FOR_ADDRESS(address);
} kasan_tbi_get_tag_address(vm_offset_t address)
e00099f0904 7f 23 03 d5 pacibsp
e00099f0908 fd 7b bf a9 stp x29,x30,[sp, #local_10]!
e00099f090c fd 03 00 91 mov x29,sp
e00099f0910 e0 43 c1 da xpaci address
e00099f0914 e1 01 80 52 mov w1,#0xf
e00099f0918 b0 ff ff 97 bl vm_memtag_add_ptr_tag vm_offset_t vm_memtag_add_ptr_ta
e00099f091c 08 00 fe d2 mov x8,#-0x1000000000000000
e00099f0920 08 fc 44 b3 bfxil x8,address,#0x4,#0x3c
e00099f0924 e0 03 08 aa mov address,x8
e00099f0928 fd 7b c1 a8 ldp x29=>local_10,x30,[sp], #0x10
e00099f092c ff 0f 5f d6 retabLLVM also uses the same logic( except stripping PAC) in HWAddressSanitizer.cpp to map a pointer to shadow memory.
Shadow = (Mem >> scale) + offsetThe scale is set to the default value of 0x4 (the same as in XNU), to effectively divides the address by 16, which means you group addresses into 16-byte chunks. as I told before for each 16-byte granule in the address space, one byte is reserved in the shadow table.
the offset is provided to LLVM by XNU through an argument.
-mllvm -hwasan-mapping-offset=$(KASAN_OFFSET) The following LLVM code generates untagging instruction and maps the memory to shadow at the instrumented points.
void HWAddressSanitizer::ShadowMapping::init(Triple &TargetTriple,
                                             bool InstrumentWithCalls) {
  Scale = kDefaultShadowScale; // Initialization of Scale
  // ... rest of the initialization logic
}

void HWAddressSanitizer::untagPointerOperand(Instruction *I, Value *Addr) {
  if (TargetTriple.isAArch64() || TargetTriple.getArch() == Triple::x86_64 ||
      TargetTriple.isRISCV64())
    return;

  IRBuilder<> IRB(I);
  Value *AddrLong = IRB.CreatePointerCast(Addr, IntptrTy);
  Value *UntaggedPtr =
      IRB.CreateIntToPtr(untagPointer(IRB, AddrLong), Addr->getType());
  I->setOperand(getPointerOperandIndex(I), UntaggedPtr);
}

Value *HWAddressSanitizer::memToShadow(Value *Mem, IRBuilder<> &IRB) {
  // Mem >> Scale
  Value *Shadow = IRB.CreateLShr(Mem, Mapping.Scale);
  if (Mapping.Offset == 0)
    return IRB.CreateIntToPtr(Shadow, PtrTy);
  // (Mem >> Scale) + Offset
  return IRB.CreatePtrAdd(ShadowBase, Shadow);
}
If we don’t untag the address, the shift operation will result in an incorrect address instead of pointing to the shadow memory. at this point we know why we did a bitwise OR followed by a right shift of 4, then addition.
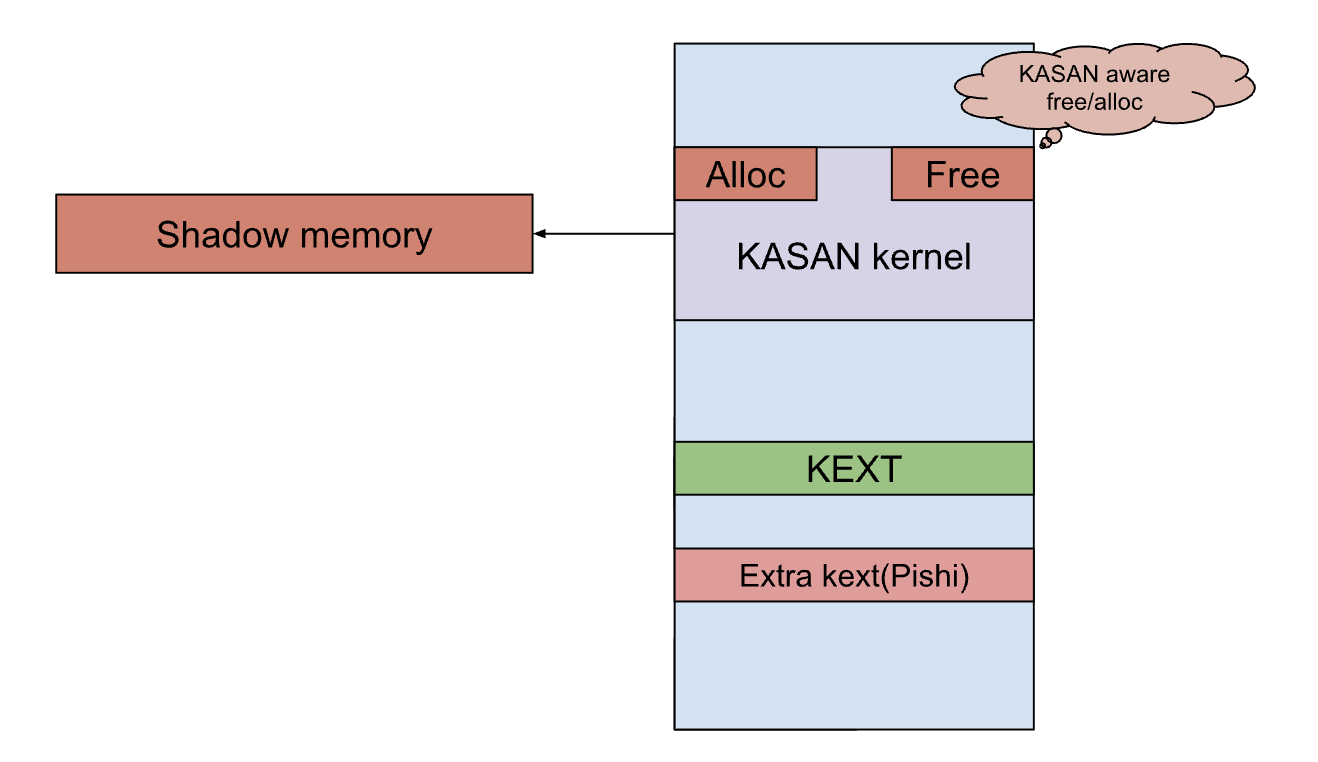
Binary instrumentation
The KASAN build of the kernel maps shadow memory, enables TBI, and tags all allocated memory. However, because KEXTs are not instrumented, even though they use tagged pointers, there is no verification during read or write access. At this point, we just need to instrument every memory read and write operation, similar to what we did in Pishi. which brings its own set of challenges, as we will discuss in the subsequent sections.
Memory allocation in KEXT
Curious readers might wonder if KEXTs use the same memory allocation mechanisms as the kernel.
If they don’t, it could be that they are using untagged pointers. We used IOMalloc and IOMallocData in our test,
but do all of KEXTs use memory allocators that tag pointers?
XNU provides two main ways to allocate memory, every memory allocation function boils down to them:
kmem_allocand similar interfaces for allocations at the granularity of pages.<kern/zalloc.h>the zone allocator subsystem which is a slab-allocator of objects of fixed size.
IOKit also uses the provided memory allocators, and these APIs tag the pointers.
Let’s see how kalloc tags pointers as it’s the main memory allocator in IOKit.
static inline struct kalloc_result
kalloc_zone(
	zone_t                  z,
	zone_stats_t            zstats,
	zalloc_flags_t          flags,
	vm_size_t               req_size)
{
...
		kalloc_mark_unused_space(kr.addr, esize, kr.size);
...
}

kalloc_mark_unused_space(void *addr, vm_size_t size, vm_size_t used)
{
	kasan_tbi_retag_unused_space((vm_offset_t)addr, size, used ? :1);
}

void
kasan_tbi_retag_unused_space(vm_offset_t addr, vm_size_t size, vm_size_t used)
{
	used = kasan_granule_round(used);
	if (used < size) {
		vm_offset_t unused_tag_addr = vm_memtag_assign_tag(addr + used, size - used); // assign tag to the pointer,
		vm_memtag_set_tag(unused_tag_addr, size - used); // update the shadow memory
	}
}
vm_memtag_assign_tag assigns a random tag to the pointer and vm_memtag_set_tag update the shadow memory for the allocated size.
It means everything is provided, we just need to instrument read and write instructions as I described above.
For the sake of curiosity, let’s briefly discuss the new and delete C++ keywords in IOKit.
As it’s documented in api-basics.md of XNU, most, if not all, C++ objects used in conjunction with IOKit APIs should probably use OSObject as a base class.
all subclasses of OSObject must declare and define one of IOKit’s OSDeclare* and OSDefine* macros. As part of those, an operator new and operator delete are injected that force objects to enroll into kalloc_type.
#define __IODefineTypedOperators(type)                          \
	void *type::operator new(size_t size __unused)              \
	{                                                           \
	        return IOMallocType(type);                                \
	}                                                           \
	void type::operator delete(void *mem, size_t size __unused) \
	{                                                           \
	        IOFreeType(mem, type);                                    \
	}
As you can see, the new operator also uses IOMallocType under the hood, which is part of the new typed allocators API, kalloc_type.
for more information and better understanding of the XNU and IOKit memory allocation read following links.
I was planning to instrument global and stack variables. as a test,
I triggered a global memory overflow in XNU using its sysctl interface,
but nothing happened. After checking the function in the kernel binary with Ghidra,
I found that global memory is not instrumented.
#define STATIC_ARRAY_SZ 66
unsigned long static_array[STATIC_ARRAY_SZ];
static int
test_global_overflow(struct kasan_test __unused *t)
{
  int i;
  /* rookie error */
  for (i = 0; i <= STATIC_ARRAY_SZ; i++) {
    static_array[i] = i;
  }
  return 0;
}
A closer look at the XNU build system shows that the software tag-based KASAN in XNU does not instrument global memory.
The build system uses the -fsanitize=kernel-hwaddress option, which does not instrument the stack or alloca calls by default, though these can be enabled with specific flags.
Stack instrumentation is enabled for all targets except WatchOS using:
-mllvm -hwasan-instrument-stack=$(HWASAN_INSTRUMENT_STACK).
However, no option is provided to enable instrumentation for global memory.
As I have mentioned before magic happens in HWAddressSanitizer.
I will not instrument global or stack memory; I will focus on instrumenting only dynamic memory allocation, as it covers most memory vulnerabilities, A non-linear stack overflow is so rare, and a linear stack overflow is not exploitable due to PAC.
I’ve shared some resources discussing the instrumentation of global variables and the stack in relation to MTE. Although these resources focus on MTE, the concepts are the same since both approaches use TBI for tagging. The key difference is that with MTE, comparisons happen automatically in the SoC, and MTE doesn’t require shadow memory.
- Address sanitizer global variable instrumentation
- ARM: Tagging global variables
- 2020 LLVM Developers’ Meeting: E. Stepanov “Memory tagging in LLVM and Android”
- Memory Tagging, how it improves C++ memory safety, and what does it mean for compiler optimizations - Kostya Serebryany
- Memory Tagging for the kernel — Tag-Based KASAN | Android Security Symposium 2020
- Akademy 2021 - ARM Memory Tagging Extension Fighting Memory Unsafety with Hardware
- Memory Tagging: A Memory Efficient Design
- ARM: Detecting memory safety violations
- Stack instrumentation with ARM Memory Tagging Extension
- LLVM: MemTagSanitizer
Instrumenting load and store instructions
Before we dive into instrumentation details of load and store instructions, let me briefly categorize and discuss the binary rewriting methods as I promised to do in the second part.
-
Trampolines: At each point where instrumentation is needed, the code is modified to jump to an instructions. at the end the instrumentation, the code jumps back to where it left off. This method is simple and easy to implement because it keeps the original code layout the same, and no internal references or branches are broken. as you remember we used this method in Pishi.
-
Direct: In this method, code is either overwritten somewhere else from scratch like a JIT or shifted to create space for the instrumentation. all references and branches need to be carefully updated to ensure everything works correctly. TinyInst is a very good example.
-
Lifting: This approach converts the binary code into a simpler Intermediate Representation (IR), similar to the one used in compilers like LLVM. The idea is that it’s easier to add instrumentation to this simpler form. After adding the instrumentation, the IR is converted back into binary code to create the final instrumented executable. QEMU’s TCG and Valgrind are two well-known examples.
-
Symbolization: This method turns the binary into an assembly listing and then applies instrumentation. taking about different binary writing methods and how to instrument memory read/write to get destination address.
I have to emphasize that sometimes these methods overlap, making it difficult to distinguish and categorize an implementation into one category.
To verify load and store instructions with help of shadow memory and pointer tag, LLVM instruments the source code at the IR level, which abstracts read and write operations in a much simpler way than a machine instructions,
it’s aware of the source and destination of the read and write operations.
LLVM finds interesting instructions before lowering them to Arm64, but we have to deal with Arm64 directly, which has many large number of instructions that read from or write to memory.
void HWAddressSanitizer::getInterestingMemoryOperands
{
  ...
  if (LoadInst *LI = dyn_cast<LoadInst>(I))
  ...
  else if (StoreInst *SI = dyn_cast<StoreInst>(I))
  ...
  else if (AtomicRMWInst *RMW = dyn_cast<AtomicRMWInst>(I))
  ...
  else if (AtomicCmpXchgInst *XCHG = dyn_cast<AtomicCmpXchgInst>(I))
  ...
}
As I told Arm64 has lots of load and store instructions.
Instruction = ["ldnp", "ldxrh", "ldarh", "stlr", "stlrb",
               "ldur", "ldaxrh", "stur", "stnp", "prfm",
               "ldrb", "stxp", "ldar", "ldpsw", "ldursb",
               "ldaxrb", "stlxp", "prfum", "stlxr", "ldxrb",
               "strh", "ldurb", "stxrh", "ldaxr", "str",
               "ldrsh", "ldxr", "ldp", "ldxp", "ldursw",
               "sturb", "stlxrh", "stxrb", "ldrsb", "sturh",
               "ldr", "stp", "ldaxp", "ldarb", "stlxrb", "ldrh",
               "ldursh", "ldurh", "strb", "stlrh", "stxr", "ldrsw",]
Like LLVM, we need to instrument load and store instructions to detect memory violations. Our trampolines should calculate the effective address of them, based on ARM64 addressing modes, and pass it to the check_kasan function, which uses shadow memory and the tag of the pointer for mismatches as we disscused about.
We explore the complexities and constraints involved in generating instructions to calculate effective addresses due to various addressing modes, and how I managed to overcome them.
Some instructions use an immediate value larger than the one that can be encoded directly in the add instruction. for example add x0, x0, #0x1120 is not a valid arm64 instruction and we can’t use it to calculate the effective address of str x1, [x0, #0x1120]
Some immediate values are negative (e.g., ldur x10, [x8, #-0x18]), but the ADD instruction in ARM64 does not support negative immediate values.
we can’t rely on a single instruction to compute the effective address.
| Instrumented instruction | Addressing Mode | Effective Address |
|---|---|---|
ldr w0, [x2] |
Base register only | Address in register x2 |
ldr w0, [x2, #-0x100] |
Base register + offset | Address in x2 - 0x100 |
ldr w0, [x1, x2] |
Base register + register | Address in x1 + x2 |
ldr x0, [x1, x2, lsl #3] |
Base + scaled register offset | Address in x1 + (x2 << 3) |
ldr w0, [x2, #0x28]! |
Pre-indexing | Address in x2 + 0x28 |
ldr w0, [x2], #0x100 |
Post-indexing | Address in x2 |
LDR Wt, label |
Literal Addressing | Address of label |
However, by combining two instructions, such as mov and add, we can reliably compute the effective address for Pre-indexing and Base register + offset.
For example, consider the instruction:
ldr w0, [x2, #-0x100]We can calculate the target address as follows:
mov x1, #-0x100
add x0, x1, x2
x0 now has the effect address of previous instruction, the decision to use x1 or x0 in the mov instruction is made during instrumentation. If the target instruction contains x0, then we will use x1.
For other addressing modes, a single add instruction is sufficient. for instance
ldrsw x16, [x17, x16, LSL #0x2]
  ---> add x0, x17, x16, LSL #0x2
and
ldr w0, [x1, x2]
  ---> add x0, x1, x2
By combining all the addressing models, we obtain the following:
+------ Post-indexing ---------+    +--- Base register only ---------+
| 1. ldr w0, [x1], #1          |    | 2. ldr w0, [x1]                |
+------------------------------+    +--------------------------------+
                     |                       |
                     v                       v
                   +---------------------------+
                   |     nop                   |
                   |     mov x0, R             |
                   +---------------------------+


+-- Base register + reg offset --+    +--- Base + scaled register off  ----+
| 3. ldr w0, [x0, x1]            |    | 4. add x0, x1, x2, lsl #3          |
+--------------------------------+    +------------------------------------+
                             |                       |
                             v                       v
                            +-------------------------+
                            |      nop                |
                            |      add x0, R          |
                            +-------------------------+


+------- Pre-indexing ------+    +-- Base register + offset ---+
| 5. ldr w0, [x1, 1]!       |    | 6. ldr w0, [x1, 1]          |
+---------------------------+    +-----------------------------+
                        |                     |
                        v                     v
                       +-------------------------+
                       |      mov R, R1          |
                       |      add x0, R          |
                       +-------------------------+
Here are a few other key points I’d like to highlight.
- The
LDR Wd, =label_exprandLDR Wt, labelbecome PC related instruction e.g.,ldr x0, 0x100003f98 <helloworld>, or sometimes just amovfor pseudo-instruction. due to relativity we can’t easily copy them somwhere else, but we can ignore them because we don’t instrument global variables.
We don’t instrument relative addresses also have to mention sometimes global variables are in form of on-non relative instruction so we can’t differentiate them with heap memory and we will instrument them for example this code will lead to the next assembly code.
struct Address {
    char city[16];
};

struct Person {
    char name[0x10];
    struct Address* address;  // Pointer to the second structure
};

// Declare global variables
struct Address globalAddress = { "bbbbb" };
struct Person globalPerson = { "aaaaa", &globalAddress };

void test_heap_overflow()
{
    char* mem = globalPerson.address->city;
    check_kasan_test((uint8_t*) mem + 0x19);
}
adrp x8,0x378000
add x8,x8,#0x100
ldr x8,[x8, #0x10] <<<-- globalPerson.address->city;
str x8,[sp, #0x8]
ldr x8,[sp, #0x8]
add x0,x8,#0x19
bl _check_kasan_testBut we don’t need to worry about this because the pointer to globale memory is tagged by KASAN_TBI_DEFAULT_TAG so at the time of the check we will not have any kernel panic.
stpandldpinstructions perform write and read operations on pairs of registers, respectively.- The effective address for loading and storing floating-point registers is also calculated using general-purpose registers.
- Ensuring proper handling of
post-indexing, for instance, inldr w0, [x2], #0x100, the effective address is simplyx2. - Ghidra decodes some instruction in the following forms:
[a, b, UXTX #0]
[a, b, UXTX]
[a, b, LSL #0]
However, we cannot encode them back, but they are equivalent to [a, b] or a + (uint64_t)b, therefore,
it is safe to replace them with [a, b].
Similarly, we can safely replace [a, b, UXTW #0] with [a, b, UXTW], which is equivalent to a + (uint32_t)b.
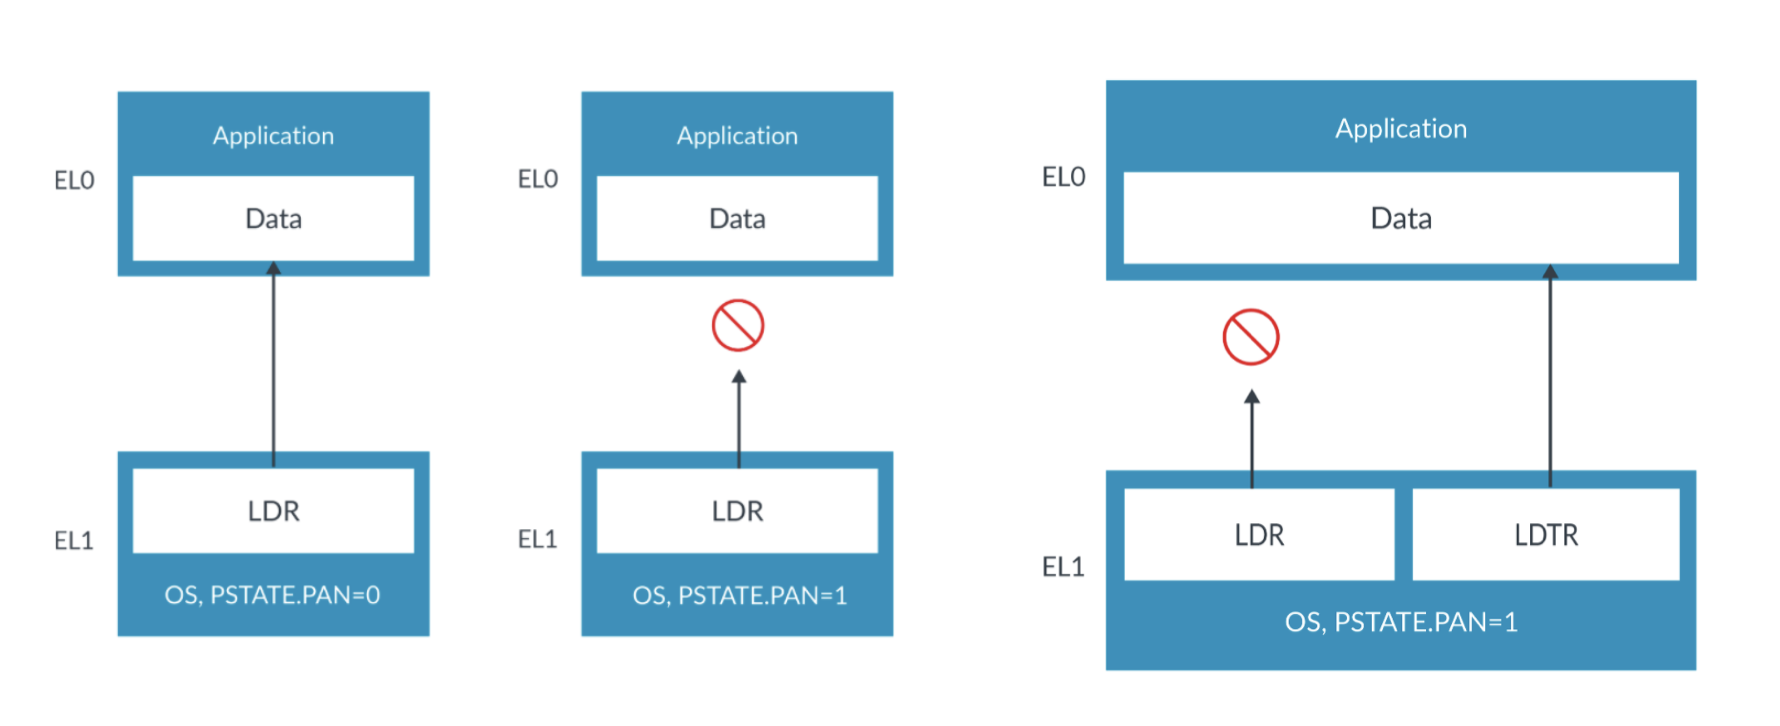
Also, we don’t need to worry about user-mode pointers. unlike the Windows kernel and its drivers, which can directly access user-mode memory( SMEP is enabled but SMAP is not), iOS enables the Privileged Access Never (PAN) feature. PAN, introduced with the ARMv8.1-A architecture in the Apple A10 processor, is a security mechanism that prevents the kernel from accessing virtual addresses shared with userspace. As a result, we can be sure that no part of our KEXTs interacts with user-mode memory.
But we should be careful about unprivileged load and store instructions.
Sometimes the OS does need to access unprivileged regions, for example, to write to a buffer owned by an application. To support this, the instruction set provides the LDTR and STTR instructions.
LDTR and STTR are unprivileged loads and stores. They are checked against EL0 permission checking even when executed by the OS at EL1 or EL2. Because these are explicitly unprivileged accesses, they are not blocked by PAN. ( images by ARM)
ARM64 uses a weak memory model, it means there is no requirement for non-dependent loads/stores to normal memory in program order to be observed by the memory system in that same order.
To have sequentially consistent ordering
Arm64 provides explicit barrier instructions(DMB, DSB, and ISB) and they have to be used after load or store instructions, which means if there is any barrier, it will be right after our trampoline( we will have a jump after original instruction to it) it means we don’t need to worry about patched instructions that relies on barriers. also I have not seen any barrier instructions in the KEXTs. they use exclusive and atomic instructions which rely on implicit barriers.
Based on the information above, we instrument the KEXT within the following loops:
- Enumerate memory read/write instructions, unlike collecting code coverage we have to instrument all of them.
- Generate instructions to calculate the
effective addressof each instruction to use it in_check_kasan. These instructions are rewritten into a trampoline that calls_check_kasan. If a tag mismatch is detected, the system will panic. Otherwise, the trampoline restores the context, executes the original instruction, and transitions to the next instruction.
void check_kasan(uint8_t *address)
{
if (address) {
uint8_t pointer_tag = (uint8_t)((uintptr_t)address >> 56);
uint8_t memory_tag = *(uint8_t *)(((((uintptr_t)address) | 0xFF00000000000000ULL) >> 4) + 0xF000000000000000ULL);
if ((pointer_tag != memory_tag) && (pointer_tag != 0xFF)) {
asm ("brk 0x0");
}
}
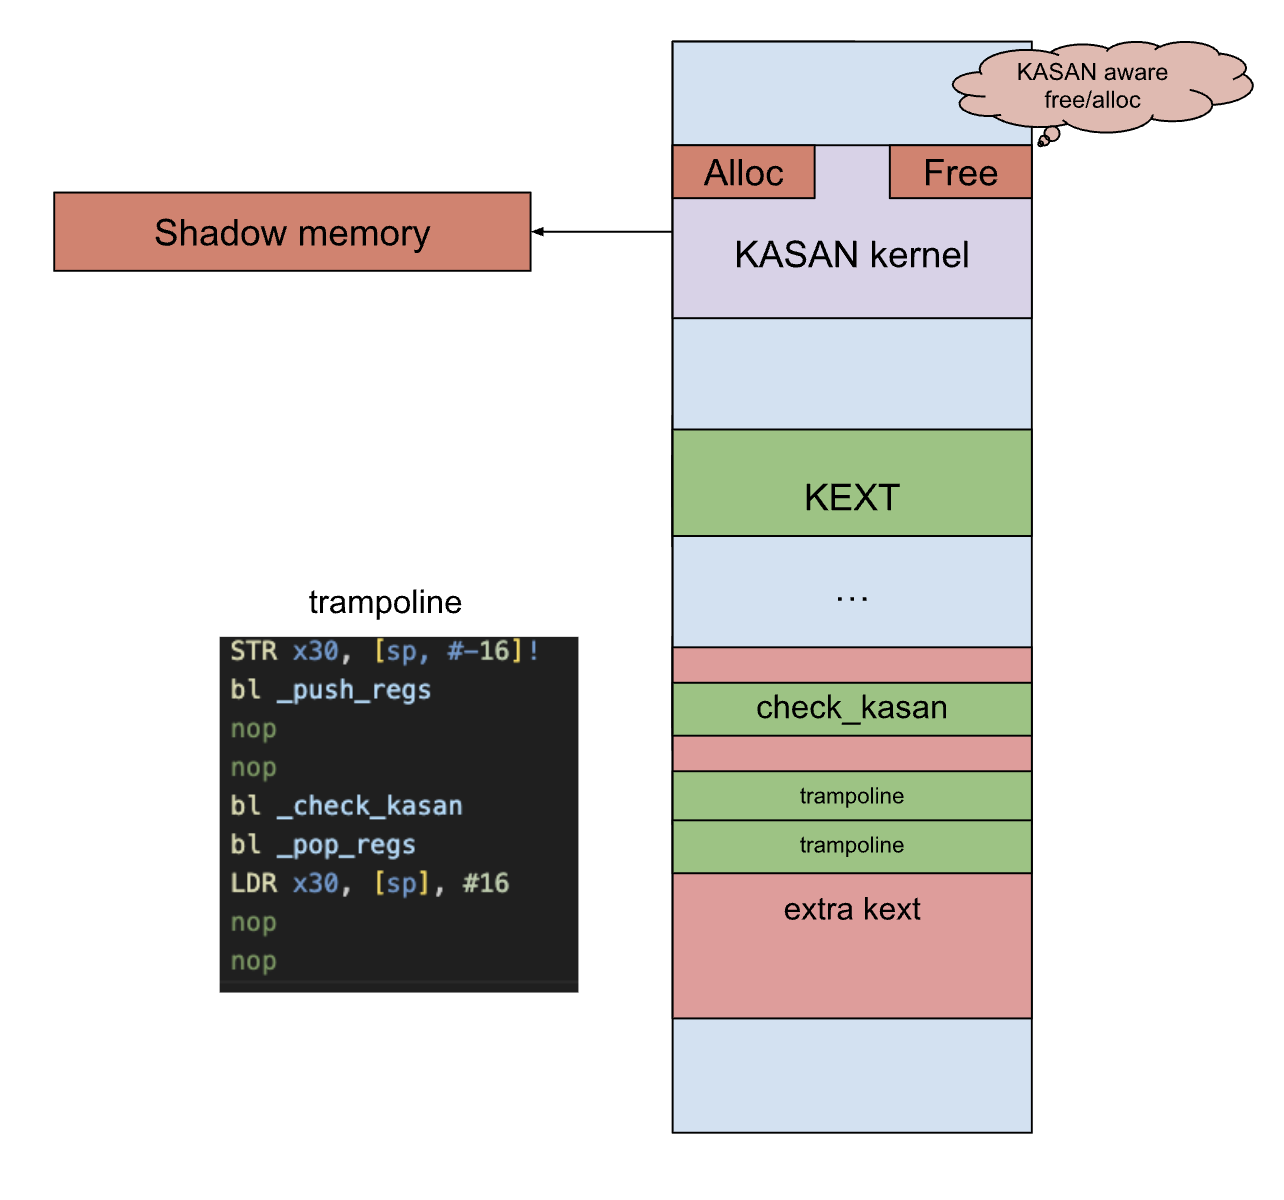
}void instrument_kasan()
{
asm volatile (
".rept " xstr(REPEAT_COUNT_KASAN) "\n" // Repeat the following block many times
" STR x30, [sp, #-16]!\n" // Save LR. we can't restore it in pop_regs. as we have jumped here.
" bl _push_regs\n"
" nop\n" // Instruction to calc effective address.
" nop\n" // Instruction to calc effective address and send it as arg0.
" bl _check_kasan\n"
" bl _pop_regs\n"
" LDR x30, [sp], #16\n" // Restore LR
" nop\n" // Placeholder for original instruction.
" nop\n" // Placeholder for jump back
".endr\n" // End of repetition
);
}
I have tested Pishi’s binary-KASAN with several KEXTs, including APFS. By combining it with our code coverage, we can achieve effective fuzzing.
KASAN for Intrinsic function
Not all memory reads or writes happen due to assigning or dereferencing pointers. Sometimes, they occur inside memory manipulation functions like memset and memcpy.
generally, these functions are implemented as intrinsic functions. An intrinsic function is a function that the compiler directly implements, when possible, instead of relying on a library-provided version.
XNU has to provide its own versions of intrinsic functions, including __asan_memset, __asan_memcpy, and __asan_memmove, to validate memory access and detect violations, in the KASAN build.
To make a KEXT’s memory manipulation functions KASAN-aware, we can find the addresses of these functions in kernel collecting via the DWARF file then enumerate all the instructions in our KEXT.
If there is a BL (branch and link) to one of the intrinsic functions, we can replace the call with the corresponding __asan version.
mov        x2,x22
bl         _memcpy
mov        w19,#0x0
mov        w8,#0x1
intrinsic_functions = ["fffffe000a517f70", "___asan_memcpy"] # fffffe000a517f70 is _memcpy
for inst in instructions:
if inst.getMnemonicString() == "bl":
if str(inst.getOpObjects(0)[0]) == intrinsic_functions[0]: # first operand of BL is the target address.
hook_to_asan(inst.getAddress(), "___asan_memcpy")mov x2,x22
bl ___asan_memcpy
mov w19,#0x0
mov w8,#0x1Benchmark
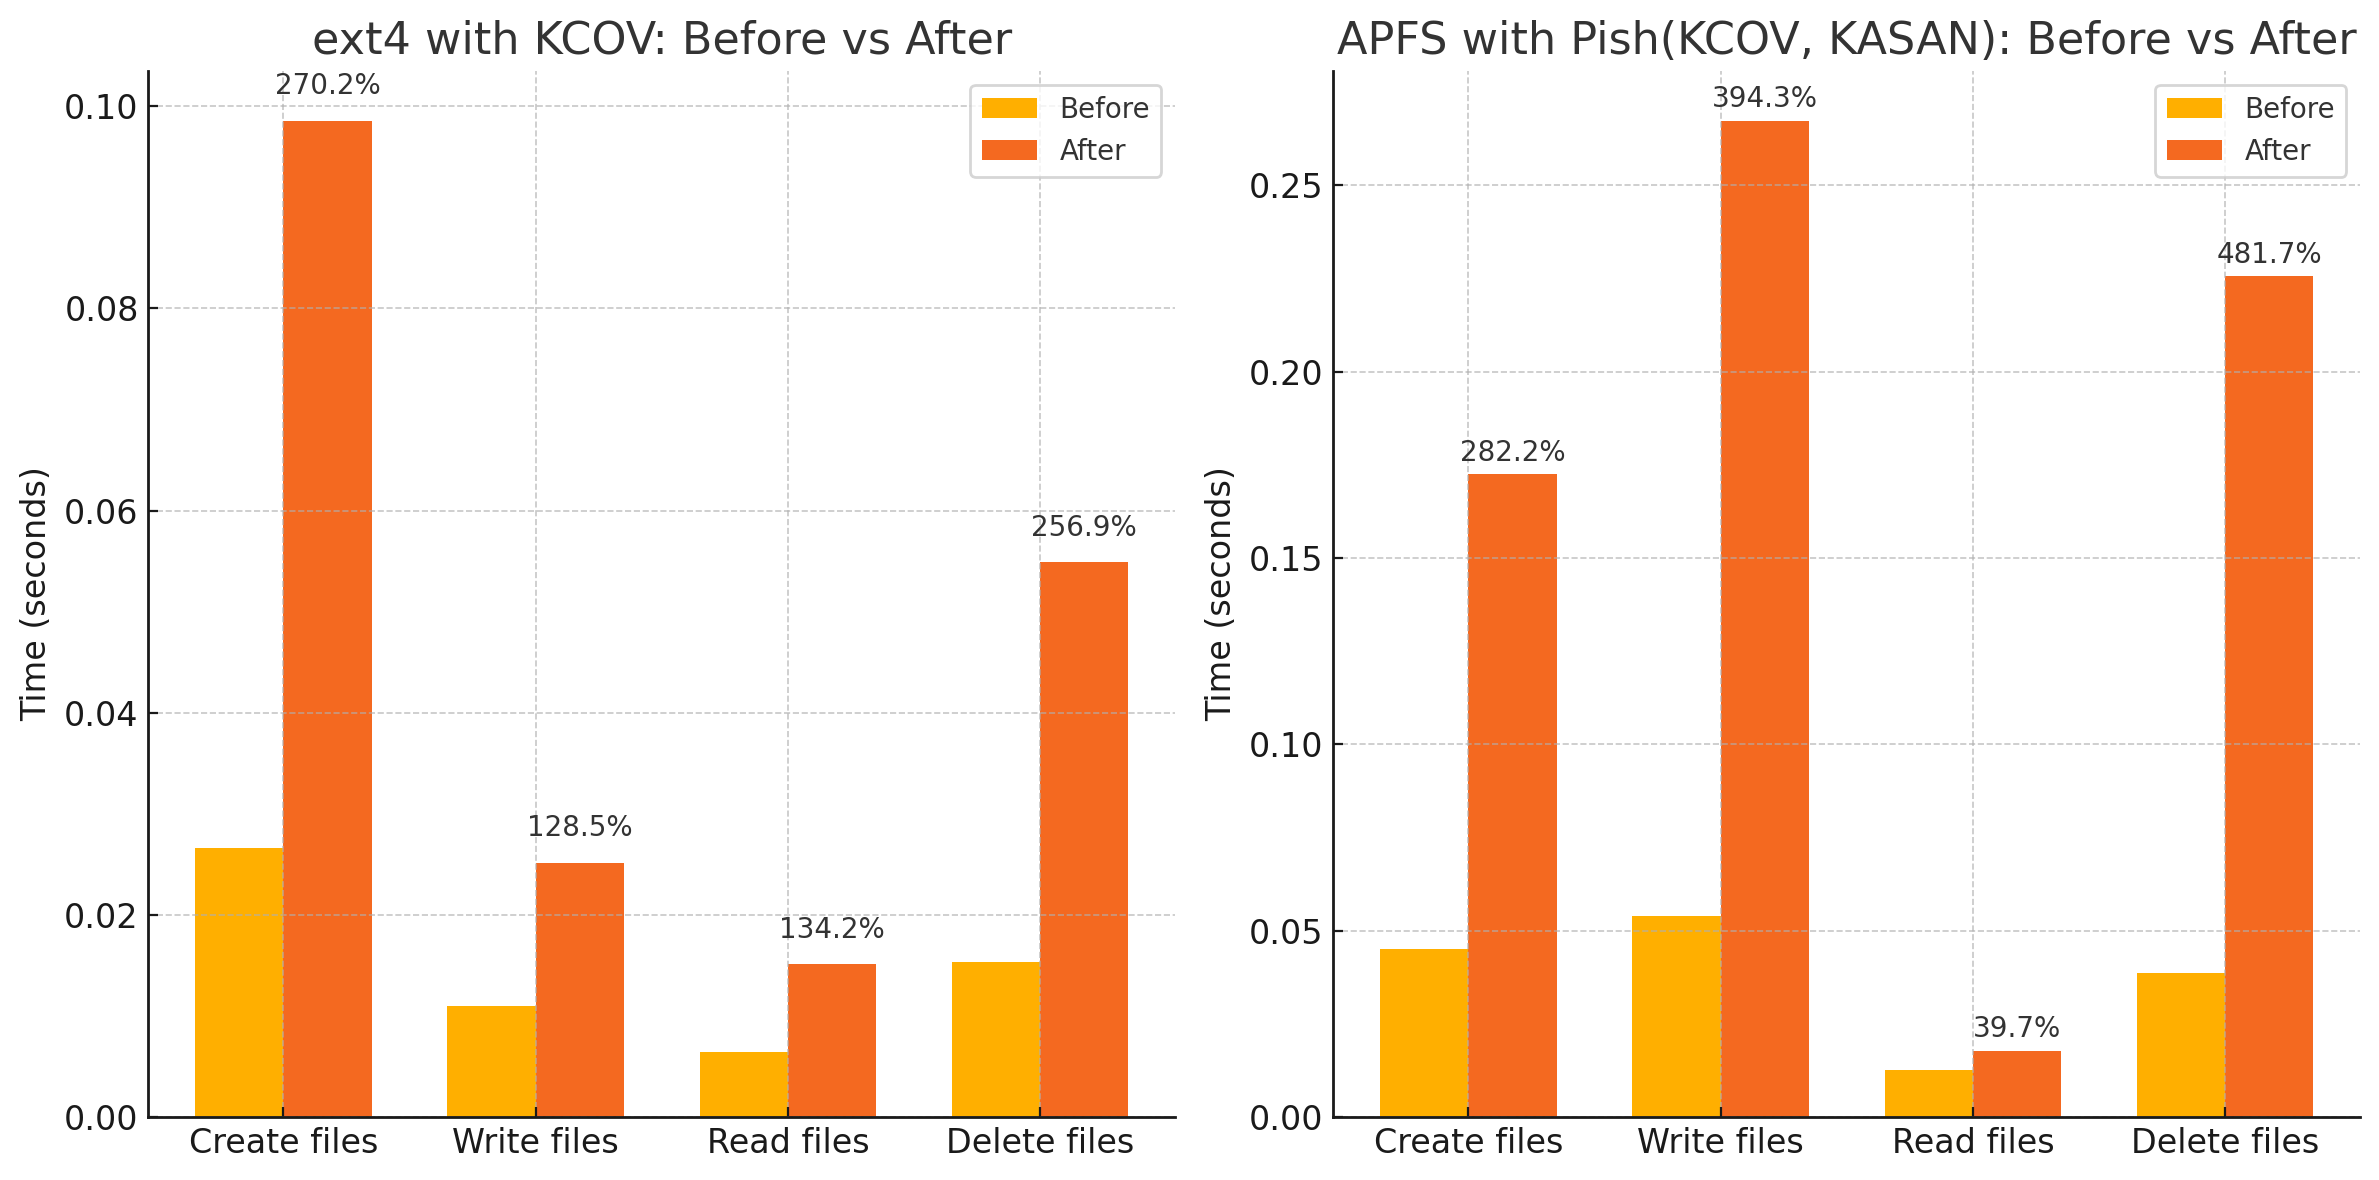
Let’s instrument APFS using KCOV and the KASAN mode of Pishi, and benchmark it similar to Part 1 of the blog.
Demonstration
Let’s look at the following heap overflow in the kernel. we will trigger this vulnerability from user mode.
void heap_overflow(uint16_t oow)
{
    char* a = (char* ) IOMalloc(16);
    printf("[PISHI] allocated: 16 index: %u\n", oow);
    a[oow] = 0x41;
}
This video shows that triggering this kernel vulnerability in a KEXT does not result in a kernel panic. To increase the chances of a kernel panic we will use Pishi.
In the second video, triggering this heap overflow in my instrumented KEXT causes a kernel panic.
Instead of directly invoking the brk instruction, I call XNU’s kasan_crash_report function to trigger a clean and classic KASAN-style kernel panic report.
The final note
LLVM instruments every memory access with the following code when building XNU with KASAN.
uint8_t shadow_tag = *(uint8_t *)((((uintptr_t)pointer | 0xff00000000000000) >> 4) + 0xf000000000000000);
    uint8_t pointer_tag = (uint8_t)((uintptr_t)pointer >> 0x38);
    if (((pointer_tag != shadow_tag) && (pointer_tag != 0xff)) &&
        ((0xf < shadow_tag ||
          (((uint)shadow_tag <= ((uintptr_t)pointer & 0xf) + 7 ||
            (pointer_tag != *(uint8_t *)((uintptr_t)pointer | 0xff0000000000000f))))))) {
            SoftwareBreakpoint();
}
This results in the kernel binary being filled with useless code that is never executed. if you rewrite above code with nested if statements, you will see that if 0xf < shadow_tag is always true because kasan_tbi_full_tag which is called by vm_memtag_assign_tag, always ORs the tag with 0xF0.
void check(uint8_t *pointer)
{
    uint8_t shadow_tag = *(uint8_t *)(
        (((uintptr_t)pointer | 0xff00000000000000ULL) >> 4) + 0xf000000000000000ULL
    );
    uint8_t pointer_tag = (uint8_t)((uintptr_t)pointer >> 0x38);

    if ((pointer_tag != shadow_tag) && (pointer_tag != 0xff)) {
        if (0xf < shadow_tag) { // if we are here then this `if` is always true.
            SoftwareBreakpoint();
        } else {
            uint8_t memory_val = *(uint8_t *)((uintptr_t)pointer | 0xff0000000000000fULL);
            uint32_t offset_check = ((uintptr_t)pointer & 0xf) + 7;

            if ((uint)shadow_tag <= offset_check || (pointer_tag != memory_val)) {
                SoftwareBreakpoint();
            }
        }
    }
}
static inline uint8_t
kasan_tbi_full_tag(void)
{
return kasan_tbi_full_tags[kasan_tbi_lfsr_next() %
sizeof(kasan_tbi_full_tags)] | 0xF0;
}Another reason the LLVM-generated code mentioned above is redundant is that tag-based KASAN can not support partial addressing modes. This is because all memory allocated with kalloc are from pre-made collection of zones, one per size class (kalloc.16, kalloc.32, …). This ensures that the allocated memory is always addressable in multiples of 16, making partial addressing ineffective. for example, if a single byte is requested, it will allocate 16 bytes. whenever a 15-byte overflow occurs, the overflow remains within the padding space and does not spill into the next allocated object. Such overflows would go undetected. interestingly, if we write 16 bytes, even without Pishi in a KASAN build of XNU, printf will catch the mismatch, its code is instrumented via KASAN as part of XNU .
char* a = (char* ) IOMalloc(1);
for ( int i=0; i < 15; i++) {
  a[i]  = 0x41;
}
printf("[Pishi] a %s\n", a);
I can’t classify them as vulnerabilities since they don’t overflow into the next object or metadata. However, this isn’t a case of objects being in zones that aren’t allocated in multiples of 16.
intra-object vulnerabilities, are another example of issues that KASAN or tag-based detection methods cannot identify.
struct S {
  int buffer[5];
  int other_field;
};

void Foo(S *s, int idx) {
  s->buffer[idx] = 0;  // if idx == 5, asan will not complain
}- https://arxiv.org/pdf/1802.09517
- https://clang.llvm.org/docs/HardwareAssistedAddressSanitizerDesign.html
- https://www.microsoft.com/en-us/security/blog/2023/01/26/introducing-kernel-sanitizers-on-microsoft-platforms/
- RevARM: A Platform-Agnostic ARM Binary Rewriter for Security Applications
- REV.NG: A Unified Binary Analysis Framework to Recover CFGs and Function Boundaries