Pishi: Coverage guided macOS KEXT fuzzing.
This blog post is the result of some weekend research, where I delved into Pishi, a static macOS kernel binary rewriting tool, which I presented at POC2024. During the weekdays, I focus on Linux kernel security at my job and would rather not investigate the Windows kernel again, which leaves macOS/iOS as the only remaining option.
In this blog post I will try to explain everything as clearly as possible so that even those who are not familiar with fuzzing can enjoy and understand it. I’ll break down the concepts, provide relatable examples, and resources, My goal is to make fuzzing approachable and interesting. before getting started I also would like to thank Ivan Fratric, for his valuable feedbacks, and mentioning Pishi in his Google Project Zero blog post.
What is Pishi?
It’s a static binary rewriting tool designed to instrument basic blocks of XNU kernel and macOS KEXTs.
for XNU kernel, Pishi allows you to instrument at a function, file, or folder level. For example, you can instrument everything in the /bsd/net/ directory or focus specifically on content_filter.c or just one specific function in the XNU source code, e.g vnode_getfromfd, to instrument only specific functions to guide the fuzzer towards the vulnerability more efficiently.
The Inspiration Behind Pishi
The idea for implementing this project came to my mind, while I was attempting to fuzz ImageIO and ended up finding 9 vulnerabilities.
ImageIO is an image parsing framework by Apple, Among many supported file formats by it, there is one Image Container, specifically HEIF.
Wikipedia describes High Efficiency Image File Format (HEIF) as a digital container for storing individual digital images and image sequences.
HEIF can store images encoded with multiple coding formats..
HEIF container specification describes various encodings that can be stored inside it, e.g. H.264, H.265, AV1.
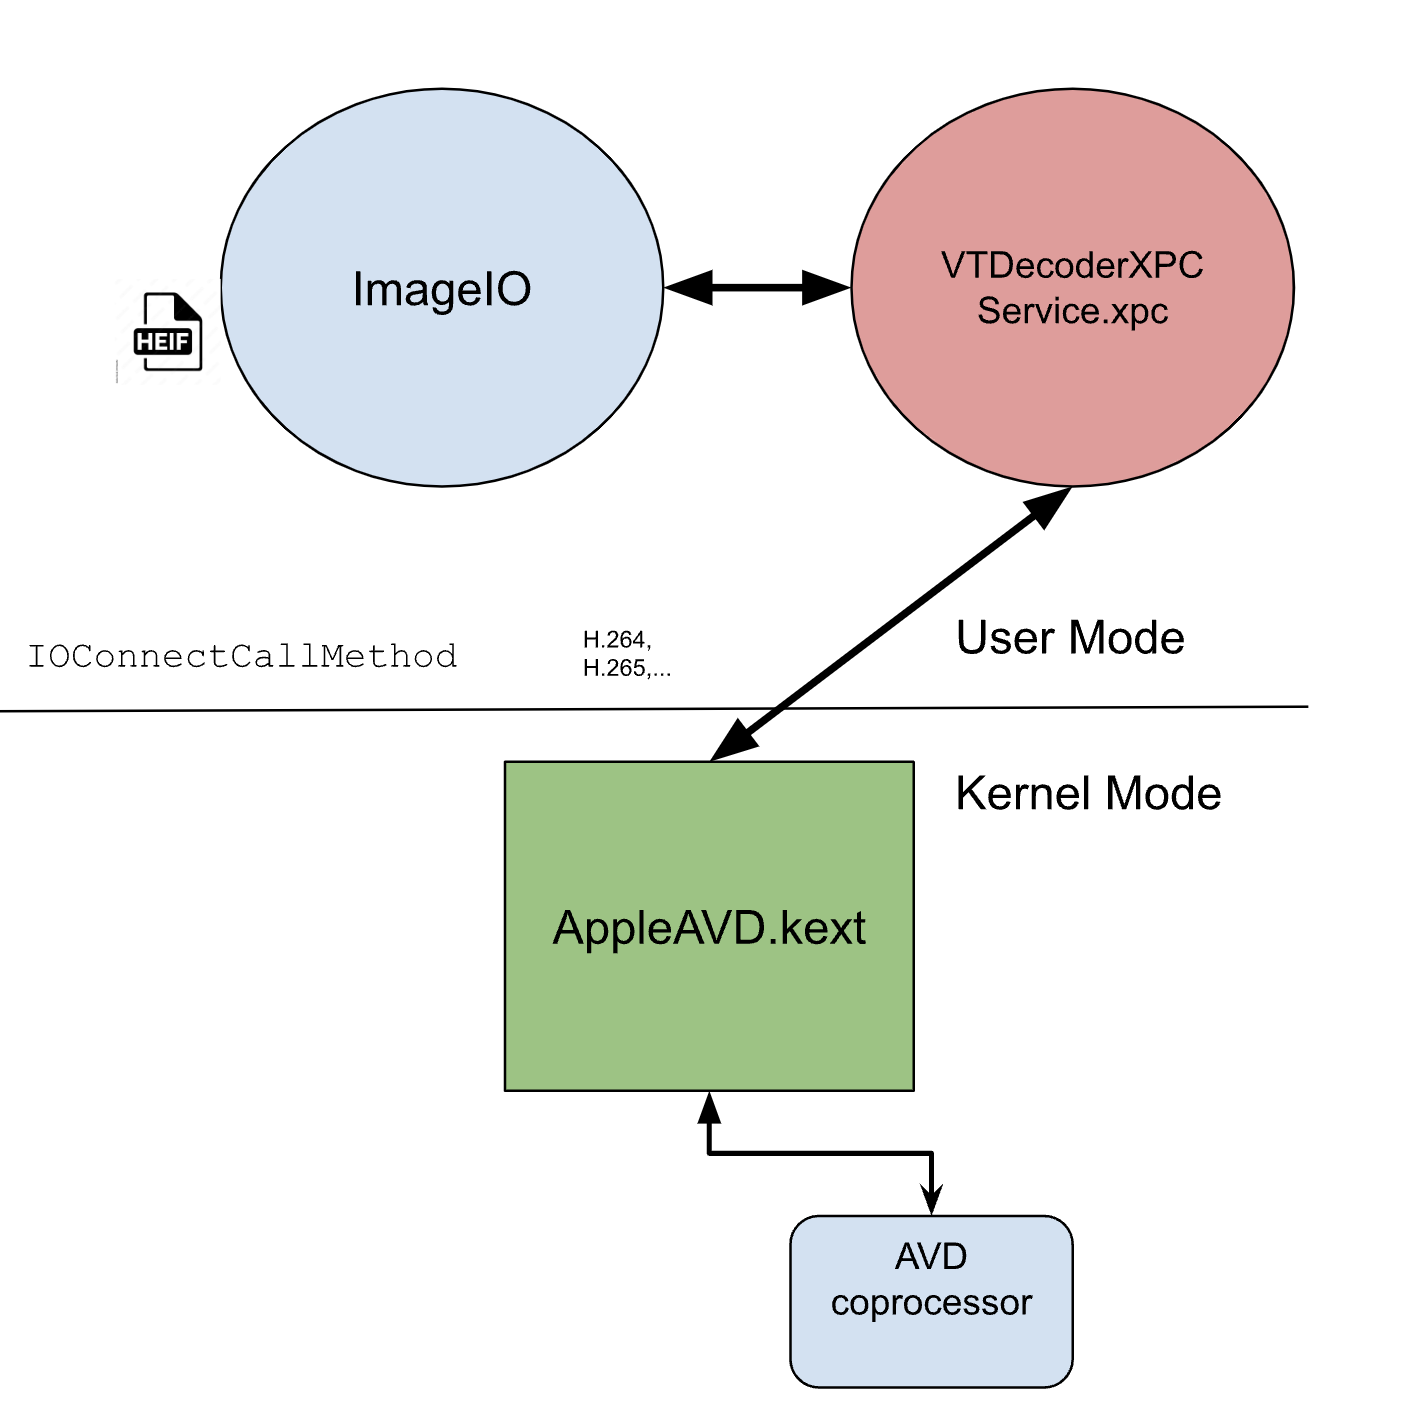
So where does this decoding(of H.264, H.265,…) happen? some parts of it inside VTDecoderXPCService.xpc a separate decoding XPC process, which talks over IOKit with AppleAVD, a closed-source KEXT, to do the main part of the job in a coprocessor over RPC.
There are some efforts to fuzz AppleAVD:
I don’t know how Natalie fuzzed AppleAVD.
and the way Cinema time speakers fuzzed AppleAVD was not what I wanted to do. The h26forge paper was also great, but it wasn’t focused on AppleAVD
My initial fuzzer used a basic buffer bit-flipping technique at the latest user-kernel communication point by interposing on IOConnectCallMethod. I used the sVTRunVideoDecodersInProcess flag (thanks to Ivan), to ensure that our harness communicates directly with the kernel rather than indirectly through VTDecoderXPCService.xpc.
But this simple approach couldn’t lead us anywhere deep into AppleAVD. I needed a more sophisticated, feedback-driven fuzzer.
Coverage-Guided Kernel Fuzzing on Apple Silicon
I was thinking of all available options to have a Coverage guided binary only KEXT fuzzer on Apple Silicon.
The first option for fuzzing open-source libraries is to use SanitizerCoverage. Even though it’s possible to build XNU with KSANCOV or porting XNU to user mode and fuzzing it there with libFuzzer, similar to SockFuzzer, but our target is closed source.
How can we instrument closed source targets?
Hardware Assisted
hardware-assisted instrumentation is a CPU-level, fast and efficient way of tracing all the instructions executed by a process. kAFL uses Intel Processor Trace feature to collect Linux kernel coverage and beauty of having CPU level instrumentation is that it’s independent of OS and CPU exceution modes (i.e, Kernel or User), researchers also have already shown its effectiveness.
Apple silicon is ARM based and AArch64’s equivalent of Intel PT is CoreSight, CoreSight is a set of hardware features designed to enable system debugging, profiling, and tracing.
AFL++ has CoreSight mode which is impelemnted by ARMored that enables binary-only fuzzing on ARM64 Linux using CoreSight.
You can read and watch more about CoreSight architecture and Hardware Assisted Tracing here and here.
Three important components of CoreSight for our goal are the ETM (Embedded Trace Macrocell), ETR (Embedded Trace Router) and PTF (Program Flow Trace).
After scrolling into XNU source code it turned out ETM, ETR and PTF are not documented in the kernel.
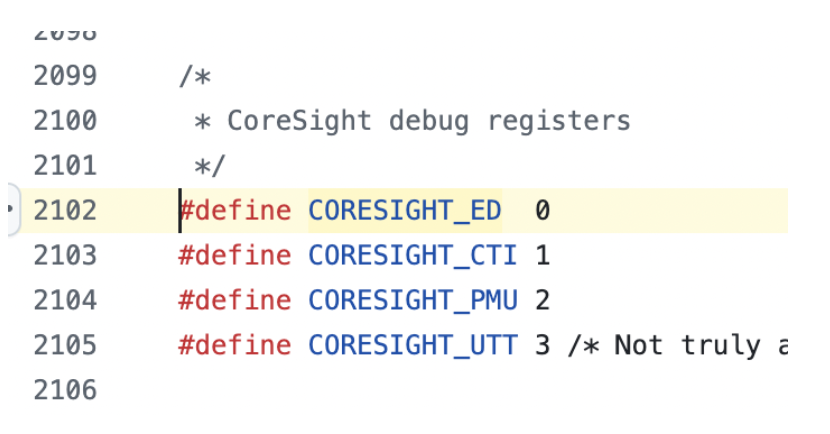
/*
* ARMv8 coresight registers are optional. If the device tree did not
* provide either cpu_regmap_paddr or coresight_regs, assume that
* coresight registers are not supported.
*/
After all just because MMIO (memory-mapped I/O) registers of these components aren’t documented in the XNU or DeviceTree doesn’t mean the SoC doesn’t have these components.
In Operation Triangulation, attackers used MMIOs to bypass hardware-based kernel memory protection, which did not belong to any MMIO ranges defined in the device tree. therefore we need to reverse engineer the SoC.
I strongly recommend reading Brandon Azad’s KTRW: The journey to build a debuggable iPhone blog post about his discovery of a proprietary CoreSight’s DBGWRAP register and how he mapped and experimented with it to determine if it’s implemented and accessible on production hardware. I needed to take a similar approach since it’s almost the same mission, While the bootstrapping problem wasn’t an issue(you can boot a custome kernel in Apple silicon), I didn’t have enough time for it. I still provide some additional excellent resources for exploring SoCs, you may find another KTRR or SPTM bypass:
- Reverse Engineering The M1 and other Corellium’s stuff.
- m1n1 and many more videos by Asahi Lina/hector martin.
- Reverse Engineering PAC on Apple M1
Software Based
There are some other options like using debuggers and software breakpoints to get code coverage:
- Talos releases new macOS open-source fuzzer
- WTF Snapshot fuzzing of macOS targets
- TrapFuzz
- Fuzzing Like A Caveman 5: A Code Coverage Tour for Cavepeople
But KDK_ReadMe.rtfd/TXT.rtf file of the KDK states that Apple Silicon does not support proper debugging:
Note: Apple silicon doesn’t support active kernel debugging. You may inspect the current state of the kernel when it is halted due to a panic or NMI. However, you cannot set breakpoints, continue code execution, step into code, step over code, or step out of the current instruction.
I haven’t looked into whether virtualization solutions like VMware, UTM, or Parallels Desktop support debugging and breakpoints on Apple Silicon.
I could also write a user mode Mach-O loader to load a KEXT in user mode and fuzz it like any other dylib, but it wasn’t an interesting option for me. I thought it may not be a generic way,
and it’s not an easy to implement.
fairplay_research project has also implemented a user mode KEXT loader.
loading kernel modules into user mode is not a new idea, it’s out there for decades e.g. ndiswrapper.
Another common method was just extracting part of KEXT code (an IDA-Pro decompiled pseudo code) to user mode, but this is not a clean and generic way to fuzz KEXTs.
Cinema time! on hexacon2022 has gone this way.
let’s review our options again, all software based binary-only Instrumentation methods are categorized into:
- Dynamic Instrumentation
- Static Instrumentation
Dynamic instrumentation inserts the code for generating feedback into the target program at run time. we discussed above that we don’t have kernel debugger in Apple silicon so this option is off the table.
Static instrumentation involes statically rewriting and modifying target binaries.
from the all above methods I decided to investigate binary rewriting. as it’s more promising than the others.
I studied some great papers about binary rewriting; they are great but they are mostly about user mode binaries. And Linux ELF files. and they have fundamental limitations when applied to macOS KEXTs.
- Retrowrite: a static binary rewriter for x64 and AArch64
- StochFuzz: A New Solution for Binary-only Fuzzing
- ArmWrestling: Efficient binary rewriting for AArch64 (Contains IL lifting)
- ARMore: Pushing Love Back Into Binaries
I also read another paper on binary rewriting KEXTs in older Intel-based macOS just as I was finishing this blog post.
KextFuzz
After more googling I saw KextFuzz: Fuzzing macOS Kernel extensions on Apple Silicon via Exploiting mitigations
An interesting article about fuzzing macOS kernel with binary rewriting.
KEXT utilizes the fact that
- Some instruction in KEXTs can be nopped away without affecting the intended behavior.
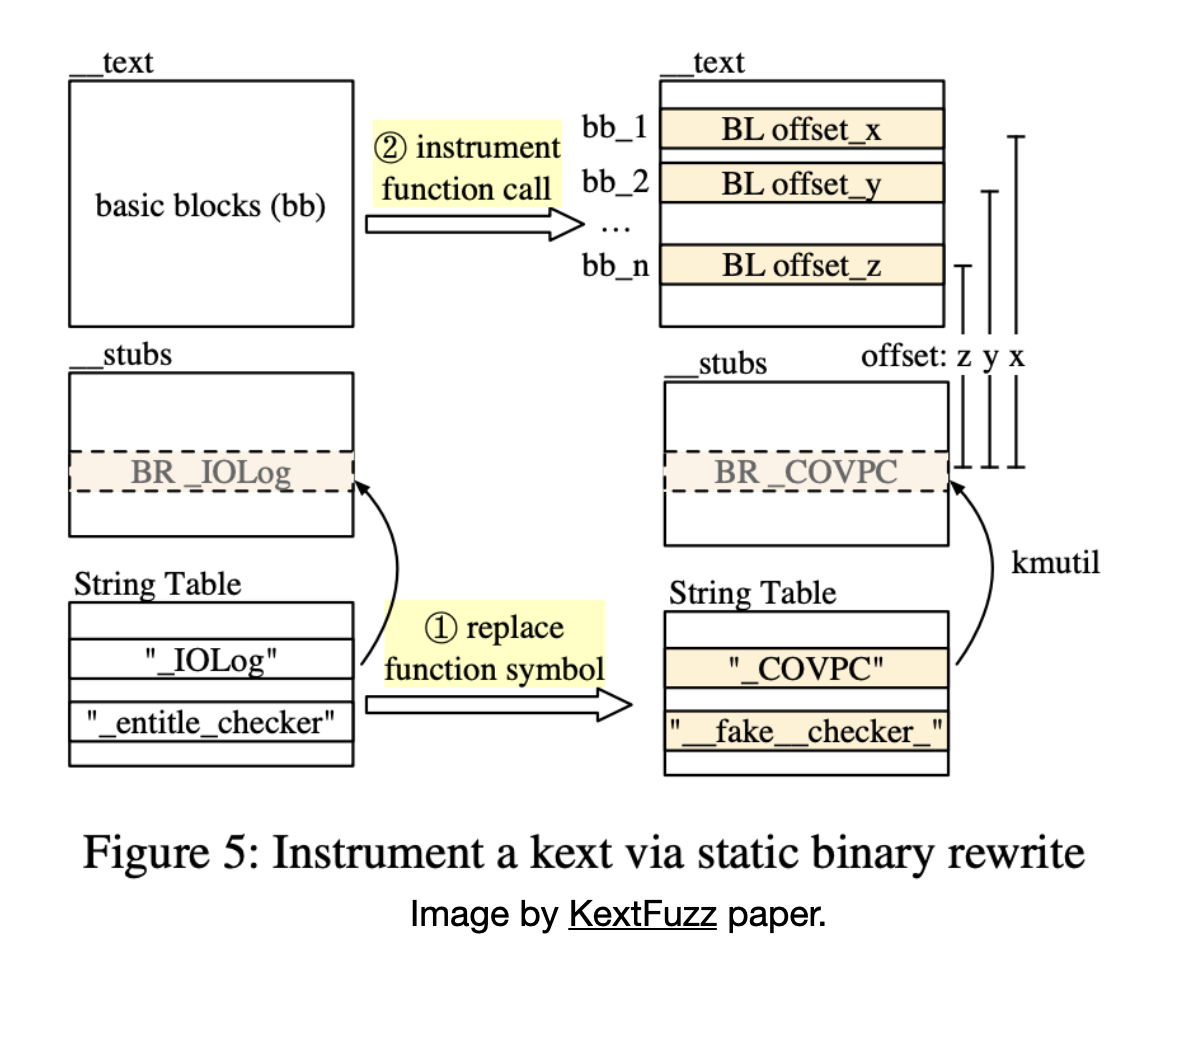
- It’s possible to hook import table in KEXTs by replacing the name of a function in the import table with a function of another KEXT, any call to the original function in the KEXT at runtime will redirect to the second function. It’s just another Import Address Table (IAT) Hooking method but in Apple’s world.
Nopping away some instructions:
Kextfuzz instrument a target KEXT by nopping away some PAC instructions and replaces them with a call to an exported function in its KEXT. PAC or pointer authentication in the Armv8.3-A architecture were introduced as a software security countermeasure for Return-Oriented Programming (ROP) attacks. PAC has been described in depth in the following articles:
- Examining Pointer Authentication on the iPhone XS
- Control Flow Integrity Anti-Malware active protection on Arm64 Systems
- PAC it up
Now as it’s described by qualcomm
There are two main operations needed for Pointer Authentication:
computing and adding a PAC, and verifying a PAC and restoring the pointer value.
In addition to the PAC and AUT instructions,
there are instructions for stripping the PAC (XPAC*),
and for computing a 32-bit authentication code from two 64-bit inputs (PACGA).
KextFuzz replaces XPACD instruction, this instructions remove a pointer’s PAC and restore the original value without performing verification.
When does the compiler emits these instructions?
Compilers inserts PAC instructions around pointer access operations. KEXTs on Apple Silicon are compiled with PAC, allowing them to protect various types of pointers, such as C++ V-Tables.
KEXTs have to inherit and implement IOKit classes and IOKit is developed in C++.
whenever codes call into a virtual function, compiler generates XPACD instruction to protect the V-Table access.
Removing this instruction or replacing it with nop will not change the expected functionality of the code.
I have described what happens around XPACD instructions whenever calling a virtual function:
mov x17, x8 ; V_table
movk x17, #0xcbeb, Isl #48
autda x16, x17 ; authentica V_table into x16
; If the authentication passes, the upper bits of the address are restored to enable subsequent use of the address.
; If the authentication fails, the upper bits are corrupted and any subsequent use of the address results in a Translation fault.
mov x17, x16 ; move x16 into x17
xpacd x17 ; strip key from x17
cmp x16, x17 ; compare x16 and x17 to see if they are equal. equal = means autda was successful
b. eg 0x9758 <_ZN20I0SurfaceSharedEvent25signal_completed_internalEyb+0x88>
brk #0x472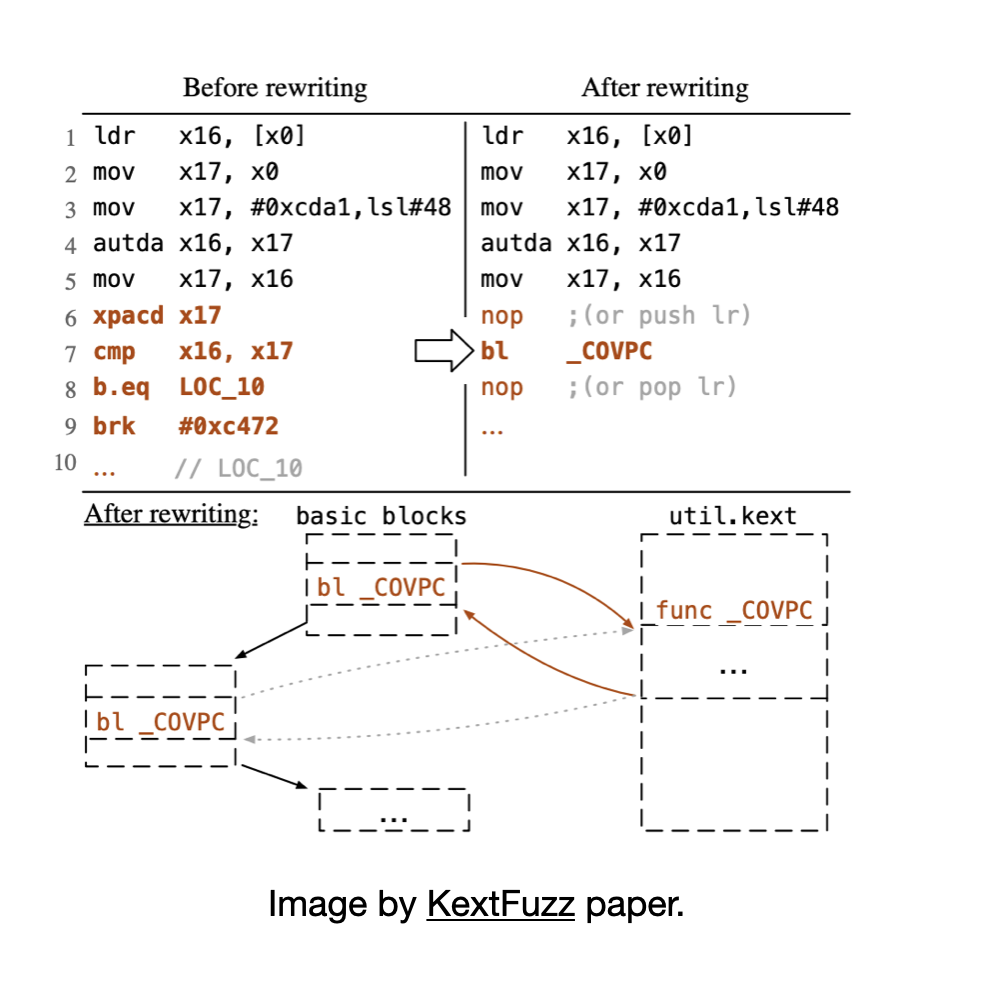
KextFuzz just assumes autda instruction is always successful, therefore it can easily nop away xpacd or in this case replace it with a hooked function call.
KextFuzz also instruments PACIBSP instruction, which is used in prologue of functions to protect against stack overflow.
PACIBSP means function level instrumentation.
PACIASP
SUB sp, sp, #0x40
STP x29, x30, [sp,#0x30]
ADD x29, sp, #0x30
....
....
LDP x29,x30,[sp,#0x30]
ADD sp,sp,#0x40
AUTIASP
RET
Hooking imported functions:
If you just replace name of a function in string table of a Mach-O file with name of another function, then at runtime the replaced funcion will be called instead of orginal function. following image depicts this idea, I described before.
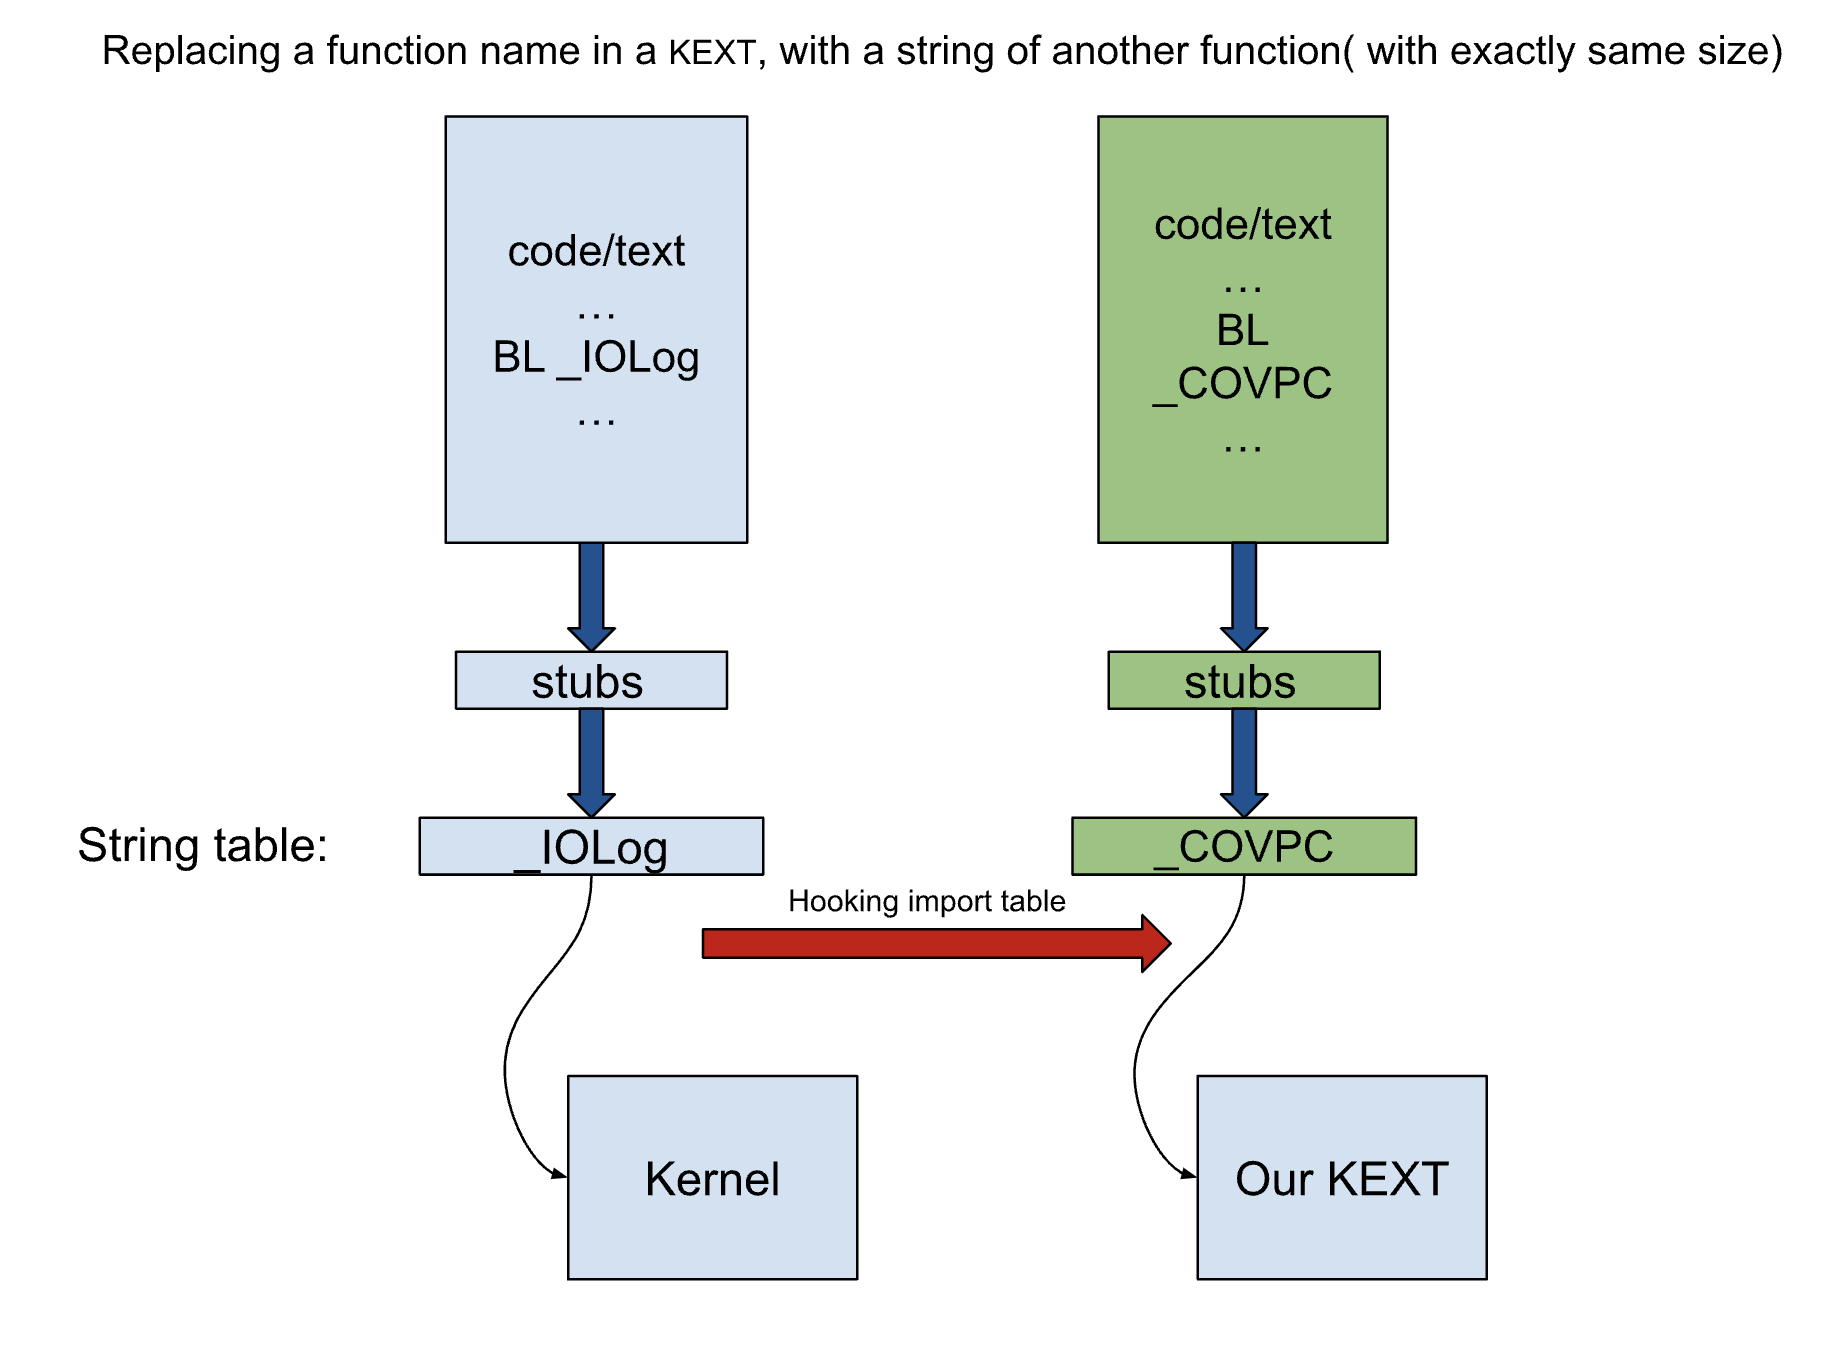
With the help of these two capabilities they can instrument some basic blocks in any KEXT
just by replacing XPACD with a call instruction to the hooked function.
as it’s shown in a image by original author.
I have found a major issue with this method, Opposite to what KextFuzz claims, This is not a basic block granular instrumentation.
KextFuzz can instrument KEXT at basic block granularity
roughly because the KEXT are developed in C++ and widely
use PA instructions to protect return addresses and indirect
calls. In addition, the PA instructions distribute at different
points of the program. By sampling the signal of these instrumented points, the fuzzer can approximately know the depth
and breadth of the current triggered code.
simple grep in IOSurface KEXT just shows we have just 198 of xpacd instruction in it.
objdump --disassemble IOSurface | grep -i xpacd | wc -l
198
Instrumenting in functions granularity and instrumenting XPACD instructions together does not cover enough basic blocks and is not informative feedback to fuzz complex codes. Only certain parts of KEXTs interact with the vtables, at least in our target AppleAVD, it will decode and parse buffers. for example kextFuzz can not instrument this function:
void fuzz_me(char* k_buffer)
{

    if ( strlen(k_buffer) > 9 )
        if( k_buffer[0] =='M' )
            if( k_buffer[1] =='E' )
                if( k_buffer[2] =='Y' )
                    if( k_buffer[3] =='S' )
                        if( k_buffer[4] =='A' )
                            if( k_buffer[5] =='M' )
                                if( k_buffer[6] =='6' )
                                    if( k_buffer[7] =='7' )
                                        if( k_buffer[8] =='8' )
                                            if( k_buffer[9] =='9' ) {
                                                printf("boom!\n");
                                                int* p = (int*)0x41414141;
                                                *p = 0x42424242;
                    }
}
We need a better coverage, how to instrument every BB?
Let’s revisit what primitives do we have. We can hook an imported function in the target KEXT(e.g AppleAVD) with a exported function from our KEXT, but we don’t know where does our KEXT will be loaded. therefore we don’t know the address of any trampoline at runtime.
At the same time I know something is wrong, we can’t just replace any random xpacd in target KEXT with a call to an imported function. as I explain in next lines.
In Mach-O file format, Calling into imported functions is done through __auth_stubs and this stub will clobber X16, X17 and LR registers.
A clobbered register is a register that gets altered or “trashed” by inline assembly code.
When using inline assembly, we need to tell the compiler which registers are changed by using clobber arguments. This helps the compiler avoid allocating those modified registers.
__auth_stubs:
  adrp	x17, 0x3c000 <_zalloc_flags+0x3c000>
  add	x17, x17, #0x0
  ldr	x16, [x17]
  braa	x16, x17
If we replace xpacd, subsequently we can’t just use call-clobbered registers later in ldar x9, [x16]. using this regsiter after xpacd is a common pattern. we need to preserve these registers before calling into the exported function. Compilers know about function calls, and they emit proper assembly with respect to callee-saved and caller-saved registers. But why is KextFuzz’s instrumentation working? Keep on reading we will answer it.
autda	x16, x17
mov	x17, x16
xpacd	x17      ; <<<<----- instrumented and replaced by a call
cmp	x16, x17
b.eq	0x9720
brk	#0xc472
ldar	x9, [x16] ;<<<<----- dereferencing x16.
Instrumenting any instruction needs at least to patch 5 instructions to store and restore what is going to be modified by __auth_stubs. we also need to put the original patched instructions somewhere.
the instrumented instructions should be replaced by:
stp x16, x17, [sp, -16]! # Push x16 and x17 onto the stack
stp lr, lr, [sp, -16]! # Push the Link Register (LR) onto the stack
bl COV_ # Call the COV_ function
ldp lr, lr, [sp], 16 # Pop the Link Register (LR) from the stack
ldp x16, x17, [sp], 16 # Pop x16 and x17 from the stack
COV_ will collect coverage, execute the original instruction and return
COV_:
  nop # executing original instructions in here
  ret
I thought the main obstacles in here is that I don’t where my KEXT will be loaded later at runtime, therefore I can’t just replace an instruction inside random BB with a jump/call to my coverage function. I can just call into an exported function.
I was thinking about modifying target KEXT by injecting some trampoline inside it then from there I could save and restore CPU context and call into my exported function.
for example modifying __auth_stubs or adding a new section (e.g., __TEXT) to Mach-O file of the KEXT. so again every BB would jump into the injected trampoline and this trampoline would save and restore needed registers, then call into a function that collects coverages. with this way I just needed to patch one instruction in each BB.
but after playing with Mach-O file of a KEXT, it turn out kmutil is very restrict about format of Mach-O,
and it just ignored my new section and didn’t allow patching other places.
kmutil is open source and it heavily uses dyld and IOKitUser.

I will explain what is kmutil in the next section.
Birth of Pishi
I have to provide an overview of loading steps of kernel modules on MacBooks.
In macOS 11 or later Apple has changed its previous scheme of prelinked kernelcaches and Loadable kernel module or KEXTs, to three prelinked kernel collection blobs:
- The
Boot Kext Collection(BKC), contains the kernel itself, and all the major system kernel extensions required for a Mac to function. - The
System Kext Collection(SKC), This contains all the other system kernel extensions, which are loaded after booting with the BKC. - The
Auxiliary Kext Collection(AKC), is built and managed by the service kernelmanagerd. This contains all installed third-party kernel extensions, and is loaded after the other two collection.
kmutil is a tool that can creates different types of Kext Collection.
The documented method for loading third-party KEXTs involves rebuilding the auxiliary KEXT collection with an additional KEXT. and the systme will load it in the next reboot.
But it’s also possible to embed any extra KEXT into Boot Kext Collection as KextFuzz was doing it.
the KextFuzz fuzzer relies on the ability to inject additional KEXTs into the boot collection.
They embed an instrumented KEXT along with an additional KEXT which contains the hooked function.
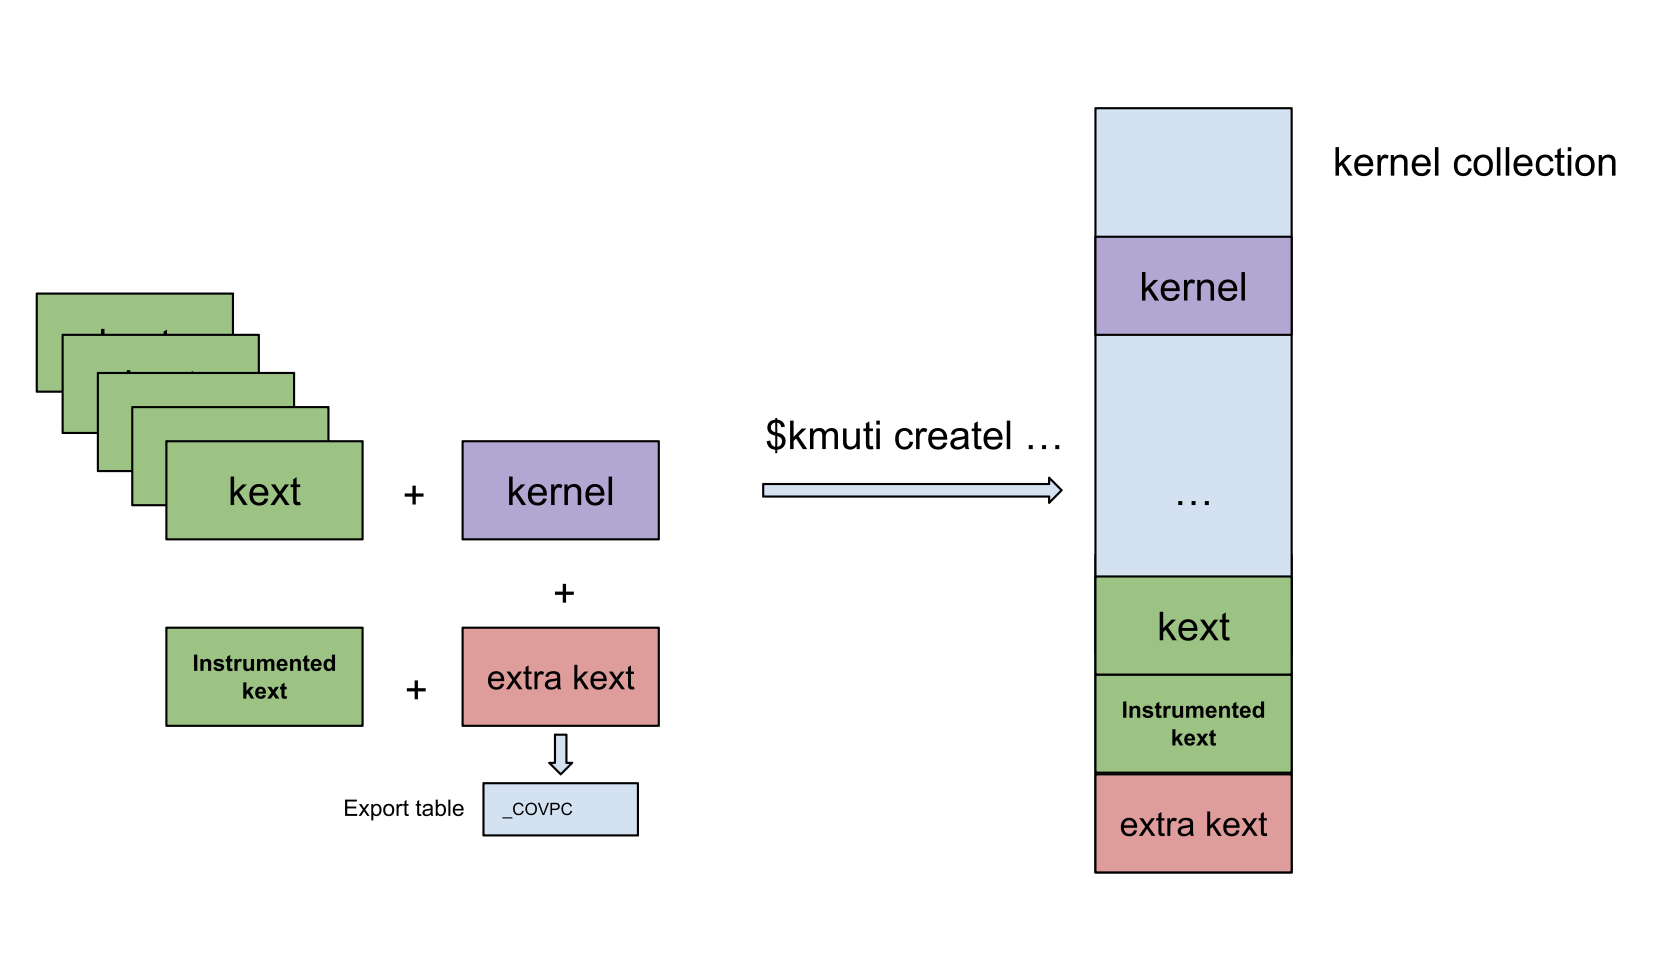
As I explain latter, there is a important difference between these two Kext Collection.
Let’s see how imported functions work in a Kext Collection and why I was getting errors when I was modifying __auth_stubs or adding sections and how KextFuzz instrumentation is working( do you remember this stub clobbers X16 and x17 without saving/restoring them?).
disassemblers showe that calling into an exported function in Kext Collection blob is just BL instruction to a relative address, instead of using __auth_stubs as a proxy.
A call into a exported function through __auth_stubs in KEXT.
bl to_a_stub_addressIs replaced with a call into function directly in Boot Kext Collection.
bl relative_address_of_function.kmutil has removed mach-o __auth_stubs.
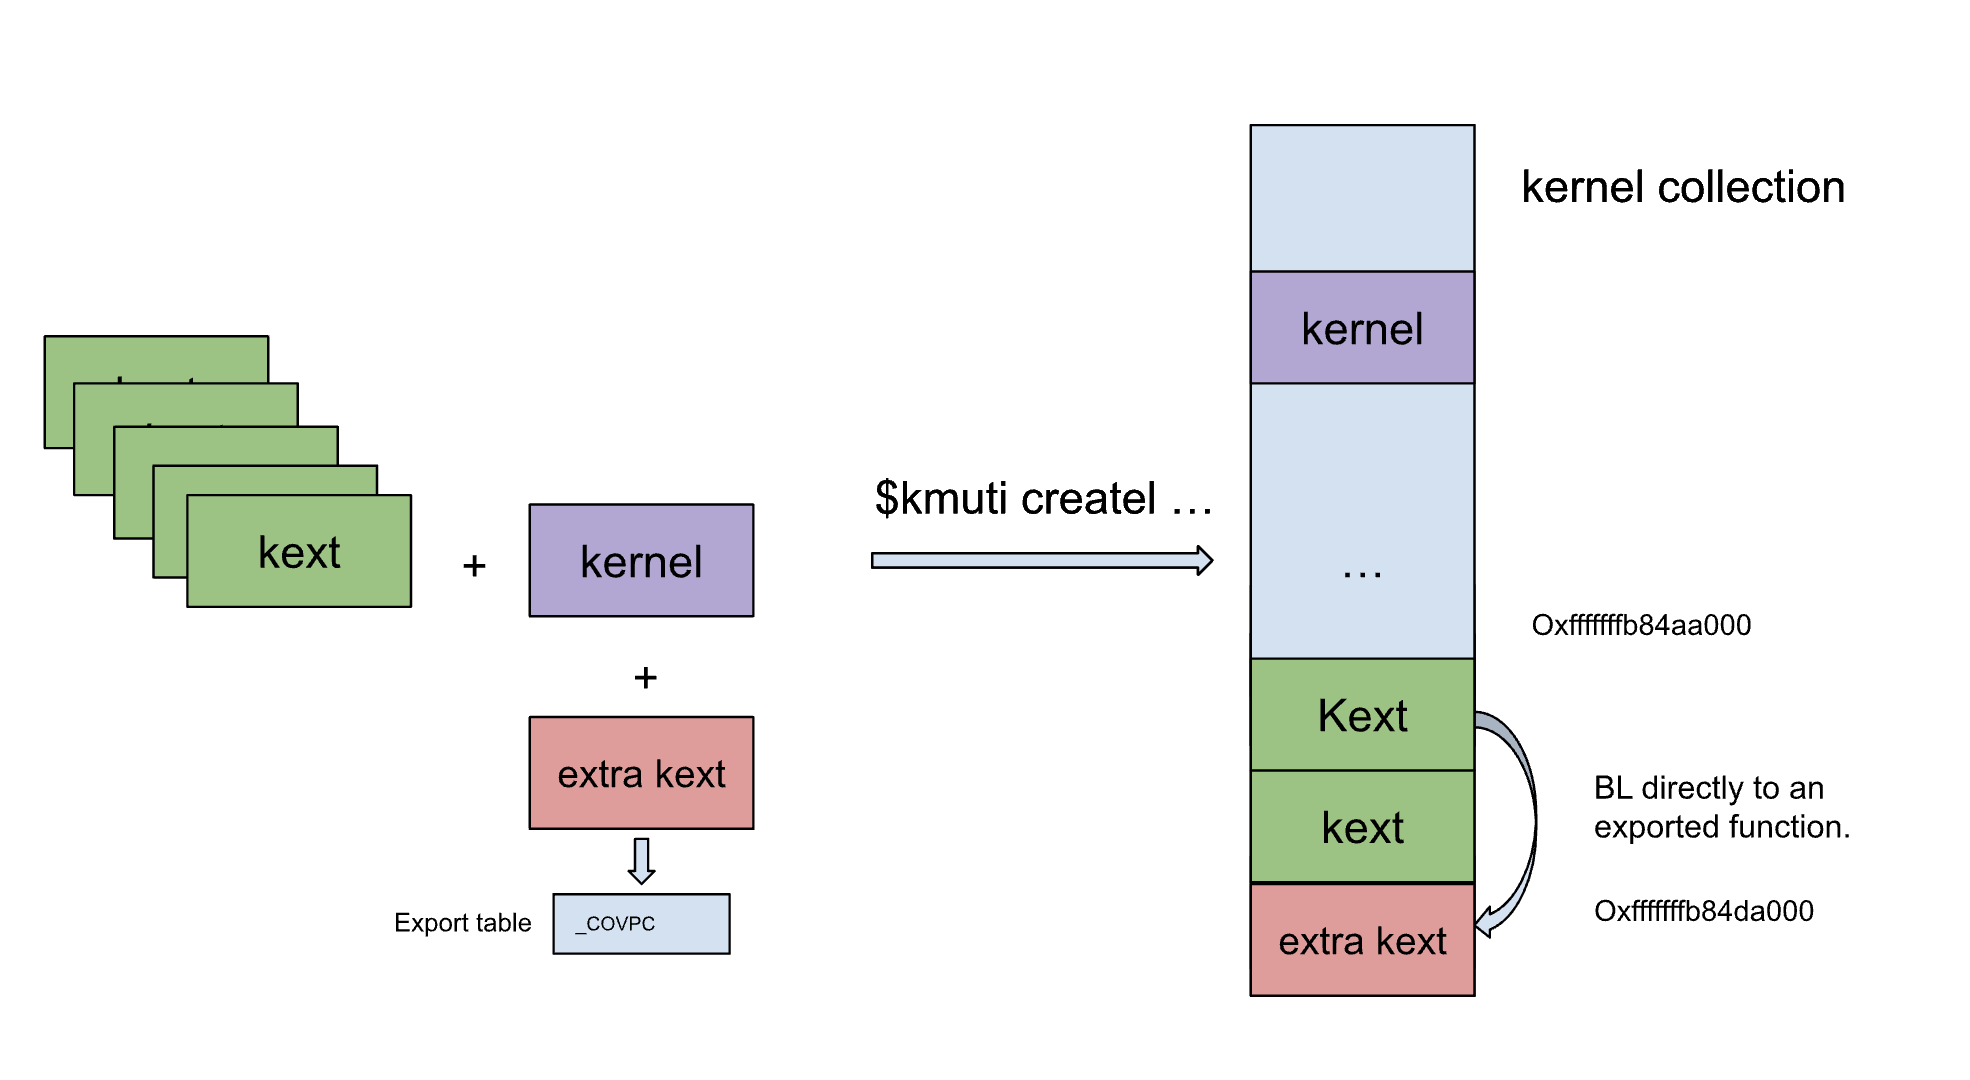
To load a depreciate on-demand loadable KEXT, kernel had to bind and fix any relative address at runtime.
but for prelinked blobs, To accelerate the boot process, these steps are executed at link time when creating a Boot Kext Collection.
Two comments inside AppCacheBuilder of dyld confirms our findings.
void AppCacheBuilder::buildAppCache(const std::vector<InputDylib>& dylibs)
  { ....
    if ( removeStubs() ) {
          // Stubs were removed, but we need to rewrite calls which would have gone through those stubs
          rewriteRemovedStubs();
      } else {
    ...
      }
      ...
  }

void AppCacheBuilder::rewriteRemovedStubs()
{
  ...
  // We need to find what the auth stubs pointed to, then rewrite all
  // users of the auth stubs to jump to those locations inst
  ...
}
But this is not the case for Auxiliary Kext Collection, kmutil doesn’t remove _auth_stubs.
bool AppCacheBuilder::removeStubs()
{
    // Only eliminate stubs in the base kernel collection.  We could eliminate stubs
    // in the auxKC too, for those calls resolved within the auxKC, but its not worth it right now
    if ( appCacheOptions.cacheKind != Options::AppCacheKind::kernel )
        return false;

    if ( _options.archs != &dyld3::GradedArchs::arm64e )
        return false;

    if ( hasSancovGateSection() )
        return false;

    return true;
}
Latter at runtime XNU will load Auxiliary Kext Collection and fix the relative addresses.
arm_init ->  arm_vm_init ->
  arm_vm_auxkc_init -> arm_auxkc_init ->
      kernel_collection_slide()
        {
          /*
          * Now we have the chained fixups, walk it to apply all the rebases
          */
        }
If the load address of KEXTs within Boot Kext Collection are relatives to each other, we can replace any instruction with a jump to somewhere else inside our KEXT without worrying about __auth_stubs.
This is a huge primitive we can hook into any addrress we like.
consequently unlink KextFuzz, instead of instrumenting a KEXT’s Mach-O file, we instrument them later inside Boot Kext Collection blob.
Instrumentation.
At this point I know how to hook into any instruction and jump to any address inside my KEXT. but how to do this instrumentation reliably without corrupting current context( CPU registers, stacks,…)? as I told before we can’t just jump into another place, we have to make sure CPU and memory state are same before and after our call.
This is classic and well documented inline hooking.
We need to have a trampoline to preserve and restore CPU registers.
and it should be compliant with Apple silicon’s ABI.
a trampoline is a technique used to redirect the execution flow of a function or method to a different piece of code.
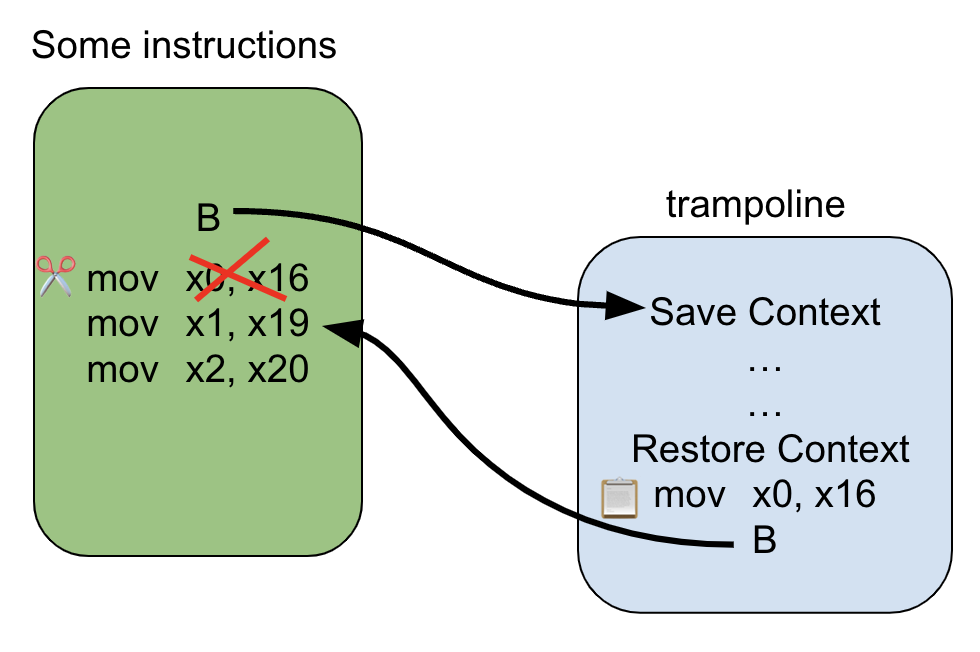
I manged to come up with the following one.
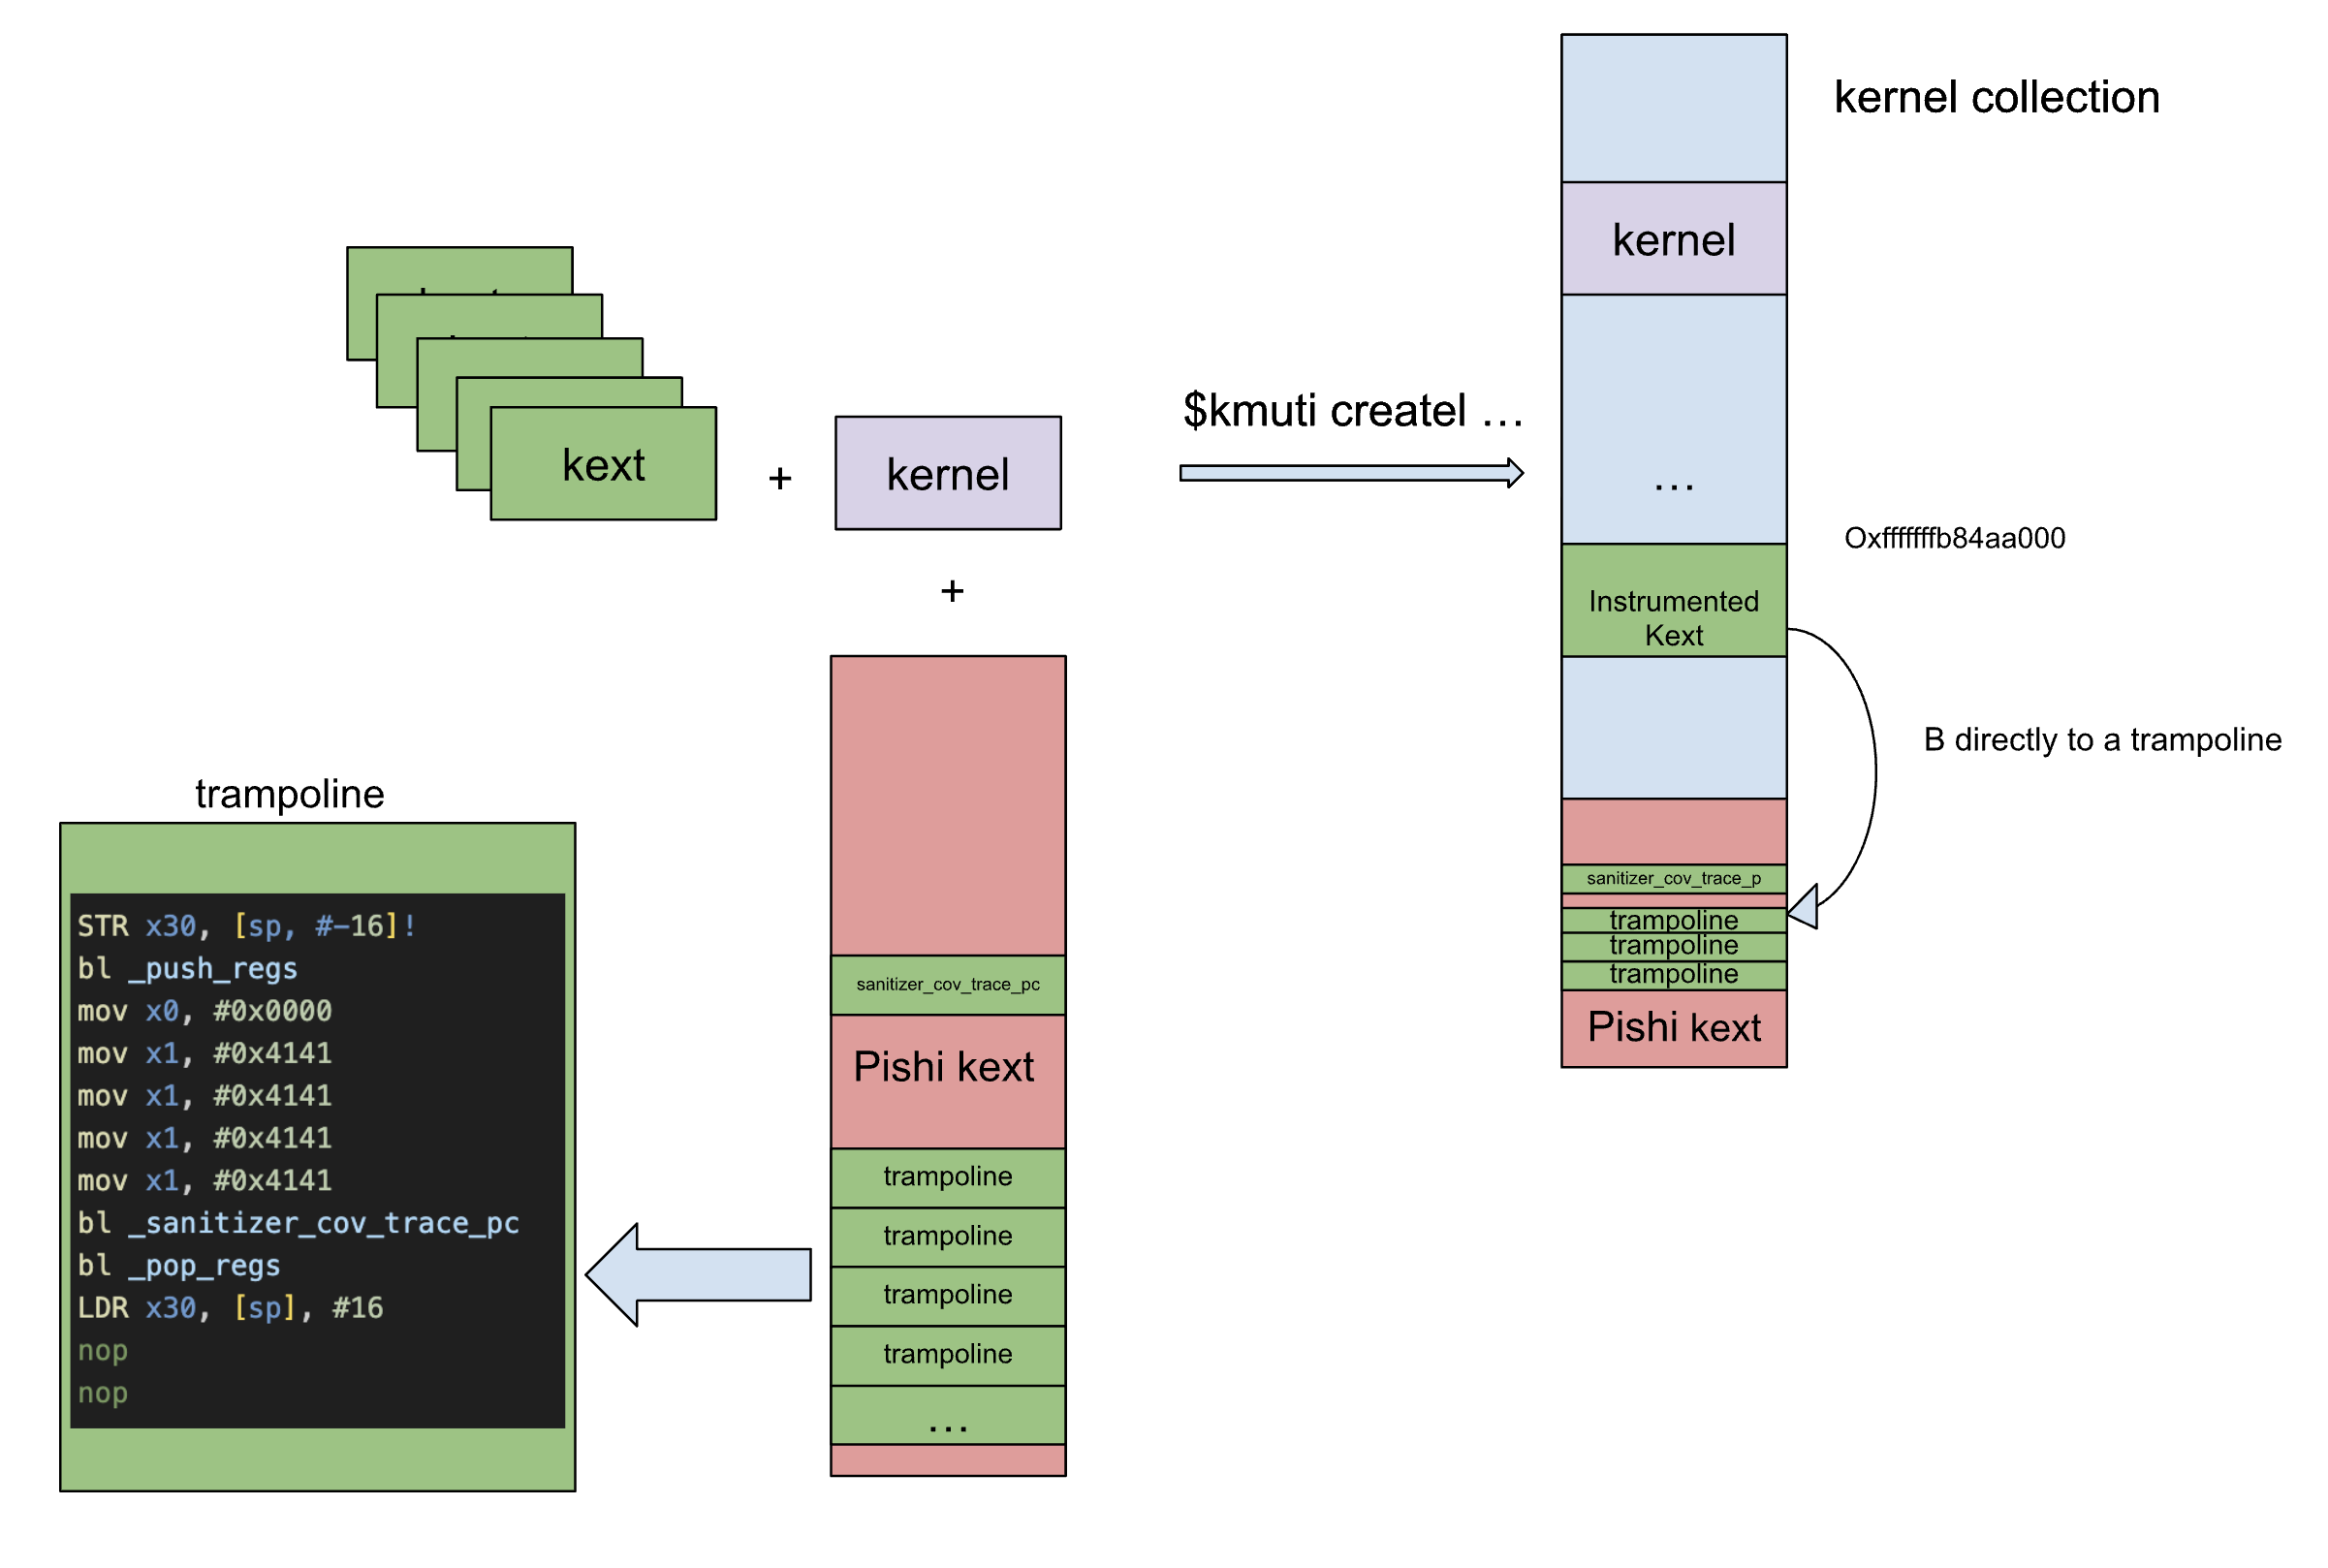
each instrumented instruction needs to jump to an instance of following trampoline to be able to work without any problems.
Placeholder for the original instruction will be replaced by the original instruction during instrumentation.
Another key point is that leaf functions do not save the LR on the stack so we need to save and restore it in our trampoline.
void instrument_trampolines()
{
    asm volatile (
                  ".rept " xstr(REPEAT_COUNT_THUNK) "\n"  // Repeat the following block many times
                  "    STR x30, [sp, #-16]!\n"            // save LR. we can't restore it in pop_regs. as we have jumped here.
                  "    bl _push_regs\n"
                  "    mov x0, #0x0000\n"                 // placeholder targeted_kext flag.
                  "    mov x1, #0x4141\n"                 // fix the correct numner when instrumenting as arg0.
                  "    mov x1, #0x4141\n"                 // placeholder for BB address
                  "    mov x1, #0x4141\n"
                  "    mov x1, #0x4141\n"
                  "    bl _sanitizer_cov_trace_pc\n"
                  "    bl _pop_regs\n"
                  "    LDR x30, [sp], #16\n"              // restore LR
                  "    nop\n"                             // placeholder for original inst.
                  "    nop\n"                             // placeholder for jump back
                  ".endr\n"                               // End of repetition
                  );
}
this instructions will do:
- Save the Link Register (LR). because we have to call a function to save the current context/registers. This call will clobber the
LR, and_push_regsis too large to be as part of this trampoline. - Save context/registers via
_push_regs. - Move BB’s ID( the address of the instrumented instruction) and KEXT’s ID number as arguments of
_sanitizer_cov_trace_pc. we will write correct number in these placeholders in instrumentation time. - Call
_sanitizer_cov_trace_pcto collect the coverage. - Restore the registers with
_pop_regs. - Restore the Link Register (LR).
- Execute original instruction. this step is the reason that each instrumentation point needs its own trampoline.
- Jump back to next instruction of the patched adddress.
As shown in the following image, our extra KEXT will include all the necessary functions, such as _sanitizer_cov_trace_pc, along with a large amount of trampolines.
We can use directives .rept .endr to spray memory(not for exploitation this time) with plenty of trampolines.
These directives allow a sequence of instructions to be assembled repeatedly.
What exactly should be instrumented?
Let’s repeat again that we want to have Coverage-guided fuzzing, Coverage-guided fuzzing is a type of feedback-aware fuzzing that employs code coverage as a metric to direct the fuzzer. It leverages this information to make informed decisions about which inputs to mutate, aiming to maximize code coverage.
Fuzzer-centric code coverage metrics can be categorized into Control flow and Data flow coverages:
- Control flow coverage:
- Basic blocks coverage
- Edge coverage
- Paths coverage
- Stack Coverage!
- Data flow coverage
First we need to define Control Flow Graph (CFG).
control-flow graph (CFG) is a representation, using graph notation, of all paths that might be traversed through a program during its execution. (Wikipedia)
Basic blocks form the vertices or nodes in a CFG, while jumps instructions represent the Edges, accordingly, a Path is defined to the specific route taken through the graph.
Wikipedia definition of BB is,
In compiler construction, a basic block is a straight-line code sequence with no branches in except to the entry and no branches out except at the exit.
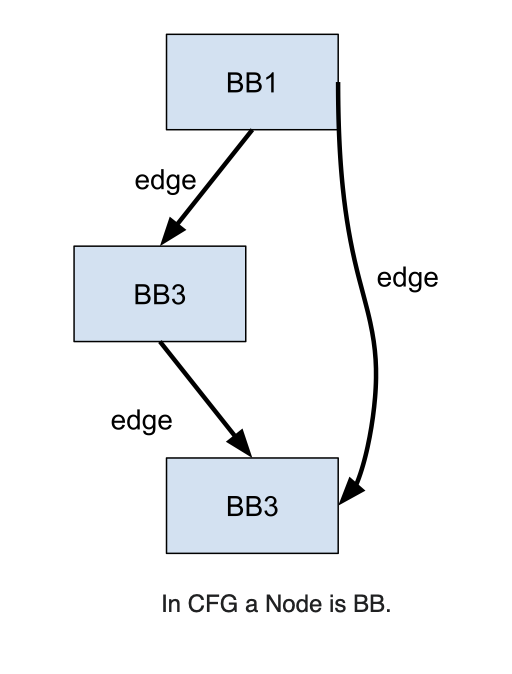
To identify interesting inputs, a fuzzer can analyze how many basic blocks are reached by the input. This is one of the simplest yet most effective ways to guide the fuzzer.
but edge coverage gives much better insight into how the program runs than just block coverage.
I can not explain the importance of the edge coverage better than the AFL technical paper.
[edge] coverage provides considerably more insight into the execution
path of the program than simple block coverage. In particular, it trivially
distinguishes between the following execution traces:

  A -> B -> C -> D -> E (tuples: AB, BC, CD, DE)
  A -> B -> D -> C -> E (tuples: AB, BD, DC, CE)

This aids the discovery of subtle fault conditions in the underlying code,
because security vulnerabilities are more often associated with unexpected
or incorrect state transitions than with merely reaching a new basic block.
Let me provide a visual example. if the execution flows from BB1 to BB2 and then to BB3, all basic blocks are covered(no vulnerability with 100% coverage). However, a use after free vulnerability happens if execution takes another path, from BB1 directly to BB3 and then to BB2.
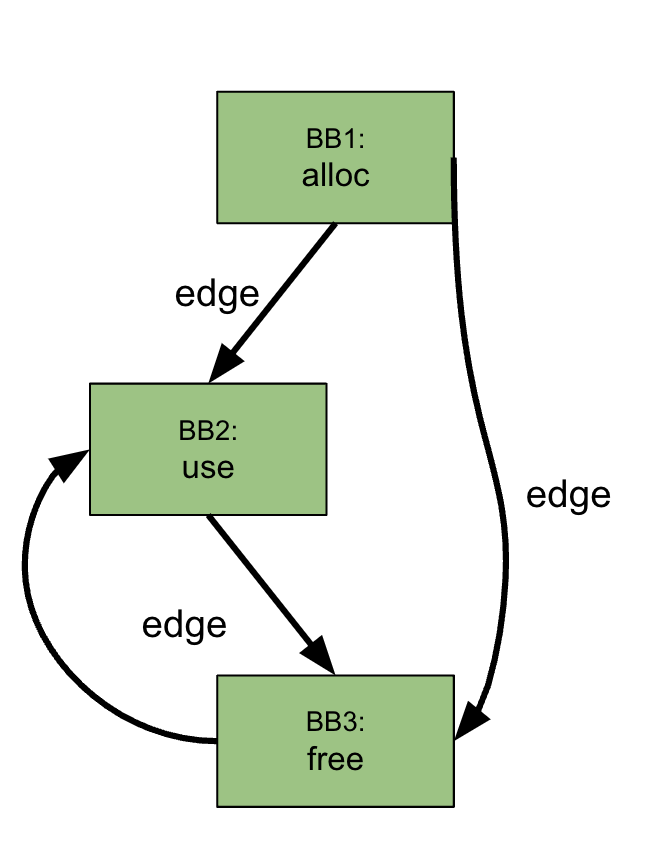
While I knew how AFL and Jackalope has implemented edge coverage, I wanted to gain a deeper understanding of libFuzzer’s coverages collection.
libFuzzer uses LLVM’s built-in coverage instrumentation (SanitizerCoverage). and among other metrics, it also claims supporting edge coverage, after spending some time in libfuzzer’s source code, I revisited SanitizerCoverage’s webpage and saw how they are trying to do it:
If blocks A, B, and C are all covered we know for certain that the edges A=>B and B=>C were executed, but we still don’t know if the edge A=>C was executed. Such edges of control flow graph are called critical. The edge-level coverage simply splits all critical edges by introducing new dummy blocks and then instruments those blocks:
void foo(int *a) {
  if (a) {
    *a = 0;
  }
  else {
    // dummy block;
  }
}
The definition of critical edge on Wikipedia is:
A critical edge is an edge which is neither the only edge leaving its source block, nor the only edge entering its destination block.
but this is not a edge coverage.
furthermore it’s discussed in ColLAFL:
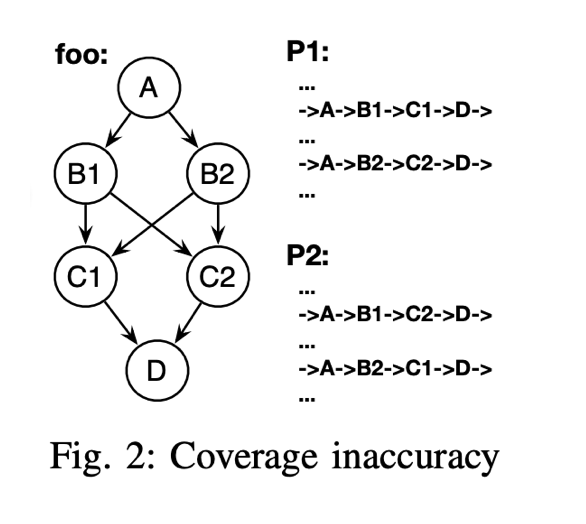
SanitizerCoverage further removes critical edges to secure the latter inference, and claim to support edge coverage. But it is just an enhanced version of block coverage. Block coverage provides fewer information than edge coverage. Critical edge is just one factor that hinders inferring edge coverage from block coverage. As shown in Figure 2, there are no critical edges in function foo. Two paths P1 and P2 share most of their edges except that they take different sub-paths in function foo. So the block coverages of P1 and P2 are exactly the same, but their edge coverages are different. For example, the edge B1->C1 only exists in path P1.
before we continue I have to say that what is happening under the hood for libFuzzer is way more complicated than this you can read about it on details beneath fsanitizefuzzer blog post.
I’d like to briefly discuss compare shattering(comparison unrolling) or sub-instruction profiling, which is associated with Data flow coverage.
Compare coverage is a method for simplifying complex comparisons in code into easier, one-byte versions that a fuzzer can easily guess.
Imagine trying to guess a password. If each attempt results an access denied, it would take a long time to crack it. However, if you receive feedback for each character you guess, you can significantly speed up the process of finding the correct password.
Compare coverage will change this comparison to the next nested if statements. guessing one out of 0xffffffff possible numbers, narrowed down to 256 possible answers each time.
if (input == 0xabad1dea) {
  /* terribly buggy code */
} else {
  /* secure code */
}
if (input >> 24 == 0xab){
if ((input & 0xff0000) >> 16 == 0xad) {
if ((input & 0xff00) >> 8 == 0x1d) {
if ((input & 0xff) == 0xea) {
/* terrible code */
goto end;
}
}
}
}SanitizerCoverage already handles these situations with __sanitizer_cov_trace_cmpX and __sanitizer_cov_trace_const_cmpX as part of its Data flow coverage.
Choosing between BB, Edge, or Path coverage involves a trade-off among performance, storage, and simplicity. Path coverage gives more insight into how a program runs, but it also makes implementation and analysis more complex with its own problems e.g. Path explosion.
I’ve decided to focus on instrumenting basic blocks for now.
AArch64 time.
Now we have to answer some more question:
- How to assemble/disassemble?
- how to find basic blocks?
- How to fix the relative instruction?
After experimenting with Keystone and reviewing TinyInst to understand how to locate basic blocks (BBs), I’ve decided to use Ghidra scripts. Ghidra supports macOS Boot Kext Collection and can enumerate basic blocks, as well as assemble and disassemble instructions. this is all we wanted.
Binary rewriting is difficult. especially in the kernel, where every mistake could trigger a kernel panic. I wanted to make instrumentation as simple as possible while ensuring that it’s efficient, reliable, and acceptable. to make instrumentation super easy and reliable I based my approach on the facts that:
- All ARM64 Instructions are 32 bits long, otherwise, it would be really difficult to patch small-sized instructions, with a big size jump. it was a real issue in x86-64.
- BBs are Disjoint sets of addresses( I explain this later).
- Almost all ARM64 instructions are non-relative.
The A64 instruction set also has support for position-independent:
- PC-relative literal loads. e.g
LDRinstruction with label. - Process state flag and compare based conditional branches.
- Unconditional branches, including branch and link, have a range of ± 128MB.
Beside above instructions we also have some other relative instructions:
- ADR: PC-relative address.
- ADRP: PC-relative address to 4KB page. ( but it definitely has one “add” after it.)
- LDRSW (literal): Load Register Signed Word (literal).
- PRFM (literal): Prefetch Memory (literal).
- PAC: when Binding Pointers to Addresses. Using the address of the pointer(PC or SP) as a Context/modifier.
AArch64 mnemonics can have 3 types of operands. Immediate, Register, Memory.
and as I told above the only PC relative operand is label and it’s only used in LDR instructions.

Branches are the edges of the CFG, so they are not part of BBs.
With respect to above points with a high probability we can find at least one non PC-relative instruction in every basic block (BB).
Some non-relative instructions:
    instruction = [
    'and',  'ldadd',   'stur',  'mov',
    'add',   'str',    'ldp',   'bfxil'
    'stp',   'mul',    'lsl',   'sub',
    'lsr',   'cmp',    'tst',   'ldur',
    'orn',   'bic',    'cmn',   'eon',
    'neg',   'adc',    'mvn',   'ana',
    'eor',   'sbc',    'orr',   'ldset',
    'ubfx',  'msub',   'udiv',  'cmhs',
    'xtn',   'fmov',   'sxtw',  'ccmp',
    'asr',   'strb',   'sbfx',  'bfi',
    'strh',  'xtn',    'uxtn',  'sxtw',
    'sxtb',  'sxth',   'uxth',  'uxtb'
    ]
Without any need for adjusting, we can easily copy and execute this instructions somwhere else in the memory.
BBs are Disjoint sets
If the first instruction of the BB is a relative instruction, additional effort is required for instrumentation. but it was also obvious that the location of instrumentated instruction within each basic block (BB) does not matter. each instruction inside one basic block represent that basic block equally.
Each basic block can be considered as a disjoint set of all addresses, which is essential for the following proof.

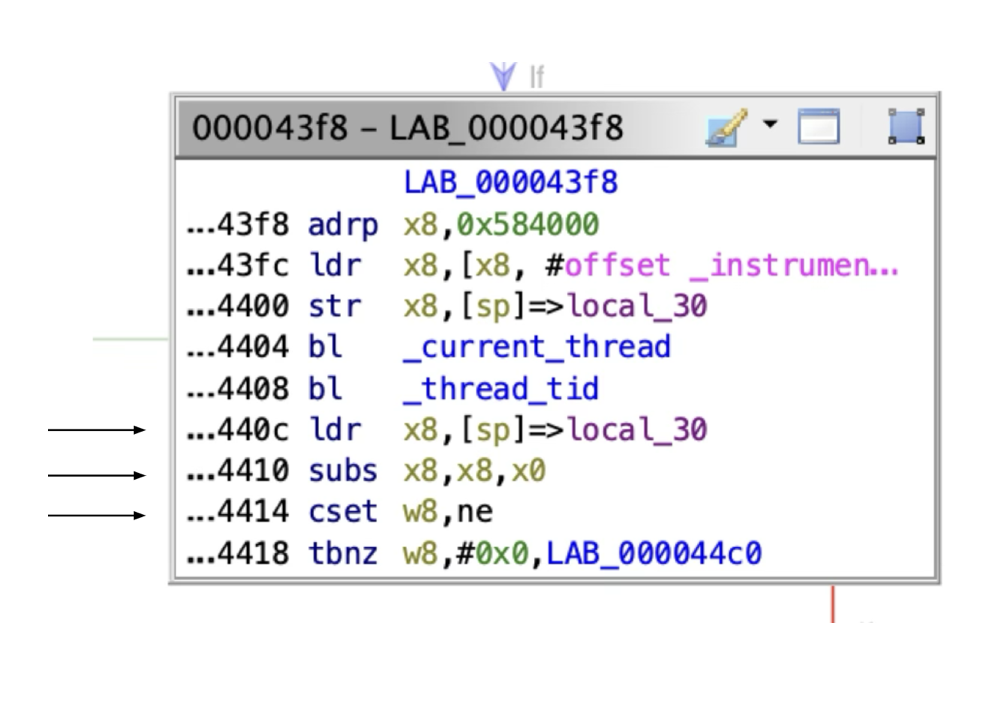
In the above image, any one of the arrowed instructions of the BB can be instrumented.
Coverage efficiency
To evaluate the efficiency of our instrumentation strategy, I instrumented IOSurface based on the above assumptions, we will instrument 6008 basic blocks (BBs) out of 7941.
The remaining 1933 BBs as depicted in the following picture are mostly single-size BBs, containing only a single unconditional jump instruction, which do not contribute to the program’s logic and can be ignored.
the question of whether an unconditional jump marks the end of a basic block is open to debate.
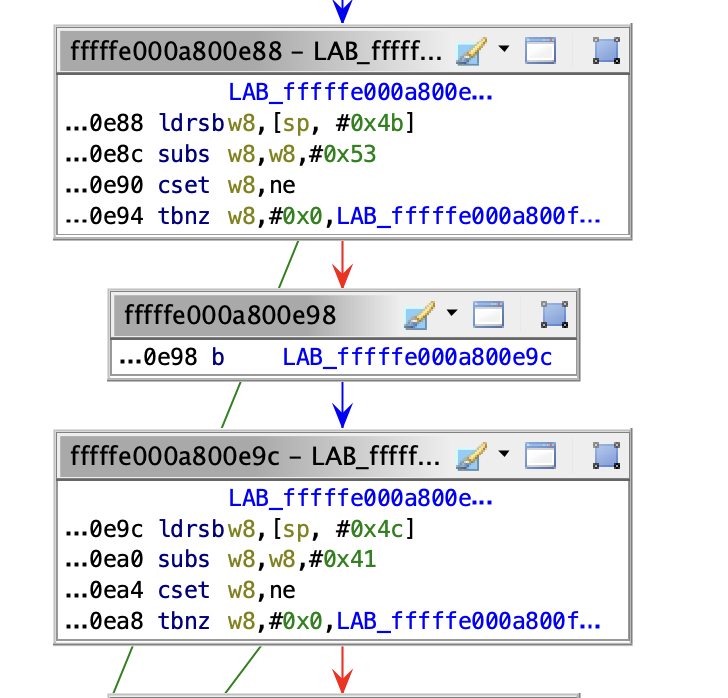
We also classify basic blocks that contain a single unconditional jump or ret along with the bti instruction as a single-sized basic block or thunks.
bti or branch target identification instructions similar to PAC are not part of the program’s intended behavior; there are emited by compiler to protect against Return-oriented programming.

Furthermore ldr is relative instruction when its operand is a label.
If we only add ldr to above the list we will have:
- 1214 BBs with just one
b, approximately 15.29% - 19 BBs we couldn’t instrument, approximately 0.24%
- 6708 BBs we instrumented, approximately 84.47%
This means we have instrumented 99.72% of valuable BBs. BBs with at least one data movement, arithmetic, logical, shift and rotate, etc instruction.
Putting everything togeter.
Before continuing, I should mention that Pishi also accepts address ranges, allowing you to precisely target what you want to instrument.
Given all above facts and assumtions
we can write a ghidra script that does following steps in Boot Kext Collection:
- Find the trampolines we had filled in our KEXT with
.rept .endrmacros. - Find all BBs in requested
address ranges, or targetKEXT. - Loop into BBs:
- Find first non-relative instruction in it.
- Replace the instruction with a jump to the trampoline.
- Fix the trampoline: orginal instruction, BB’s ID, a jump back to the next address of instrumented instruction.
- Use next trampoline.
I also have to note that the ghidra script was maddeningly slow, due to the fact that it had to instrumnt tens of thousands BBs in each KEXT file. After some investigation, I managed to replace the bottleneck function in Ghidra with a super-fast version.
Let’s see the results following image is the Boot Kext Collection aftre instrumentation. left side instrumented BB and right side is the fixed trampoline.

Collecting Coverage
Now that we have instrumented the BBs, we can collect coverage inside our _sanitizer_cov_trace_pc function.
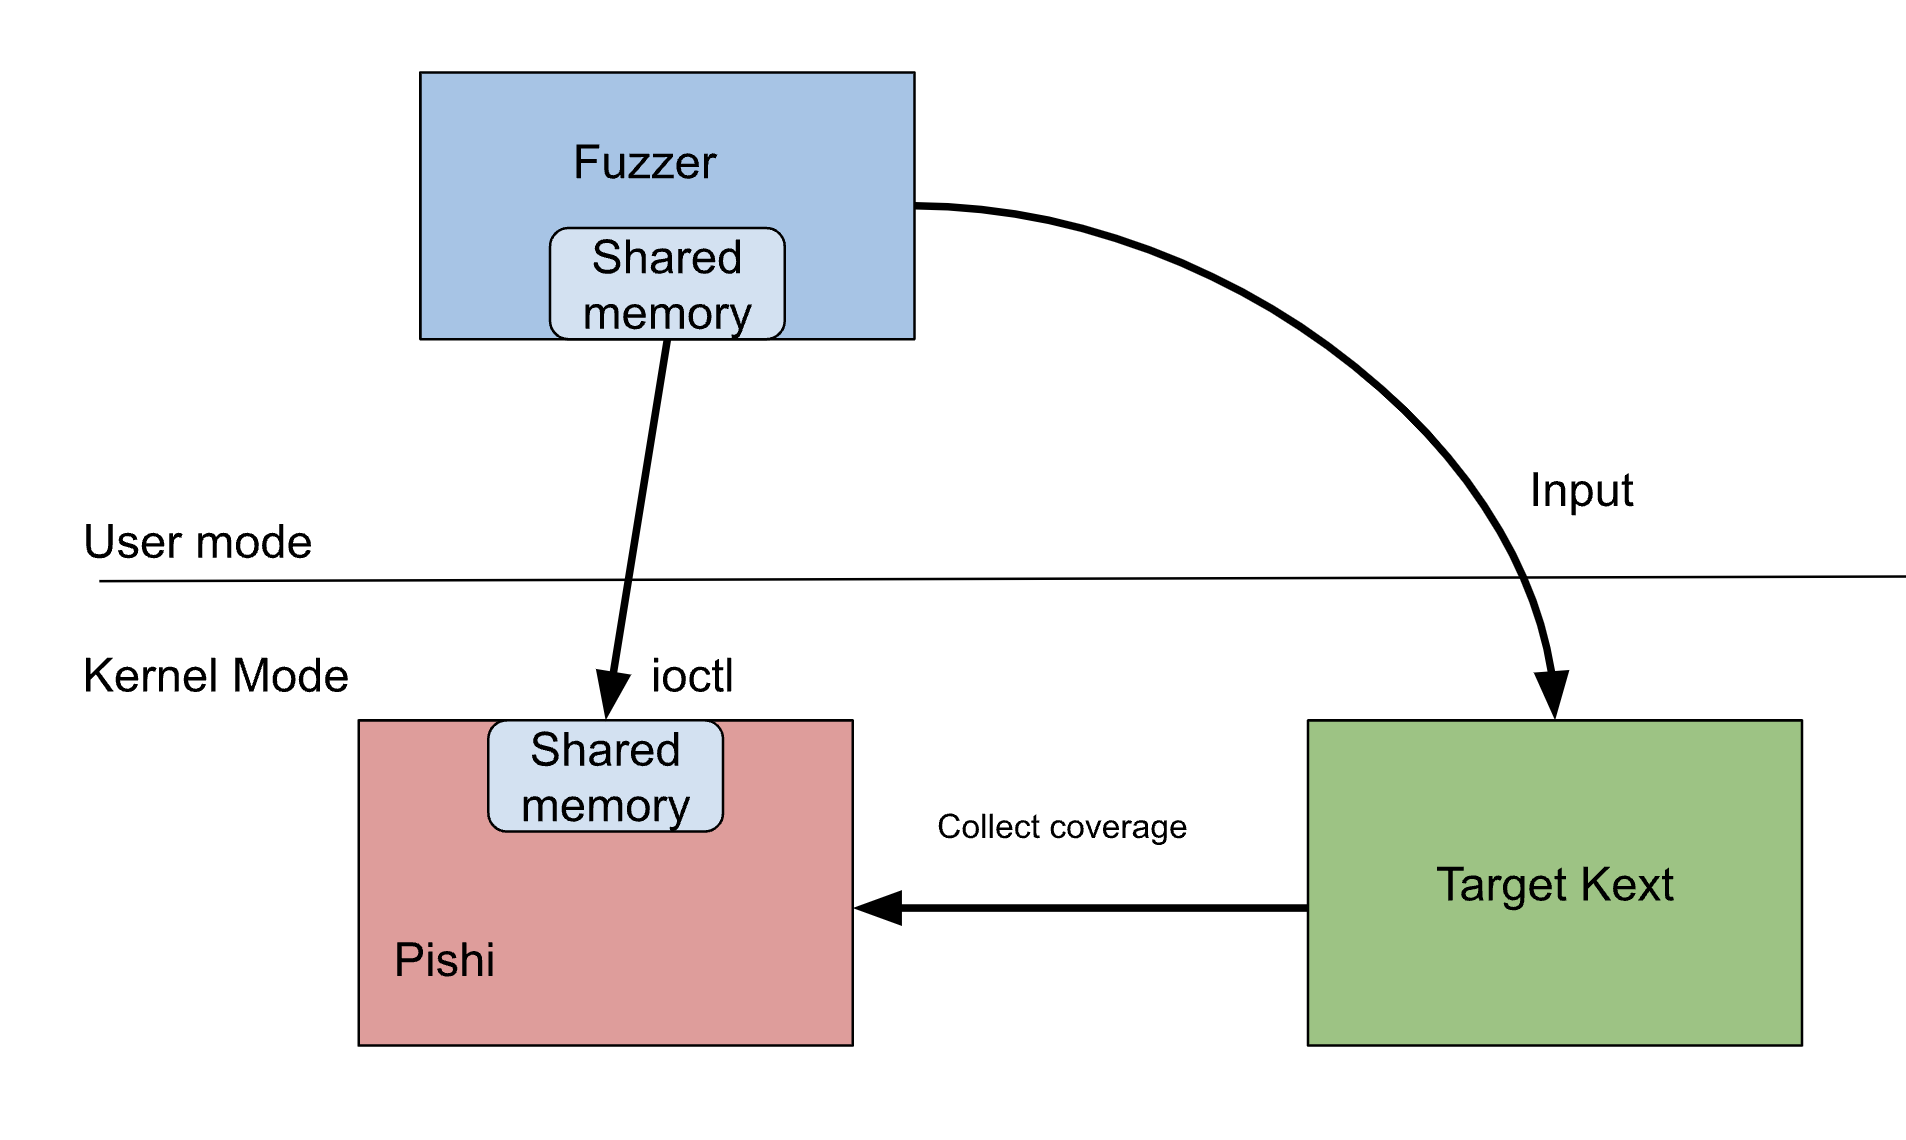
My implementation of _sanitizer_cov_trace_pc resembles Linux KCOV. It collects coverage exclusively for the target thread, assigned through an IOCTL. The collected data is then written into coverage_area, a shared memory between the fuzzer process (EL0) and Pishi’s KEXT (EL1).
void sanitizer_cov_trace_pc(uint16_t kext, uintptr_t address)
{
    if ( __improbable(do_instrument) ) {
        /* number of cases we want to reject due to wrong thread id is a lot more than targeted_kext so we compare it first. */
        if( __improbable(instrumented_thread == thread_tid(current_thread())) ) {
            /*
                I just added targeted_kext to be able to instument multiple KEXTs at once,
                instead of build/install/boot for each KEXT. simple benchmark shows it has not that much performance penalty.
            */
            if ( __probable( (targeted_kext & kext) == kext) ) {
                if ( __improbable(coverage_area == NULL) )
                    return;

                /* The first 64-bit word is the number of subsequent PCs. */
                if ( __probable(coverage_area->kcov_pos < 0x20000) ) {
                    unsigned long pos = coverage_area->kcov_pos;
                    coverage_area->kcov_area[pos] = address;
                    coverage_area->kcov_pos +=1;
                }
          }
        }
    }
}
How to feed the coverage to a fuzzer?
We need to tune a fuzzer to be able to feed our coverag into it, once I have used libFuzzer’s Extra coverage counters,
you can read about it in my another blog post here Structure-Aware Linux kernel Fuzzing with libFuzzer.
libFuzzer collects different signals to evaluate the code coverage: edge coverage, edge counters, value profiles, indirect caller/callee pairs, etc. These signals combined are called features (ft:). Extra coverage counters is also part of the features.
If you check how libFuzzer collects coverages in the TracePC::CollectFeatures method, you will see that similar to -fsanitize-coverage=inline-8bit-counters, the extra counter is also an array of 8-bit counters.
With -fsanitize-coverage=inline-8bit-counters the compiler will insert inline counter increments on every BB. This is similar to the depricate -fsanitize-coverage=trace-pc-guard flag but instead of a callback the instrumentation simply increments a counter.( in the next blog post we will also increment counters inline and and optimize away function calls)
Unfortunately, it seems that the macOS version of libFuzzer has not implemented Extra coverage counters. this is not a big probalem, we can add this functionality into it, we just need to export a buffer and add some changes to FuzzerExtraCountersDarwin.cpp file, then build LLVM.
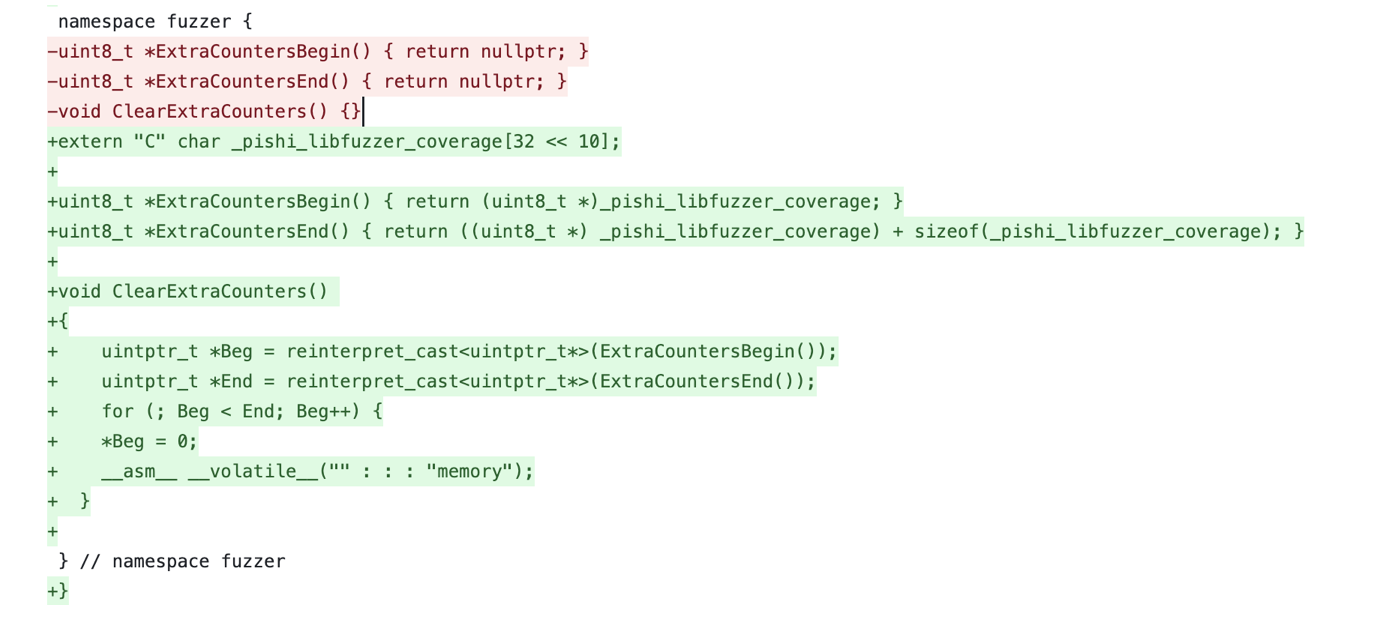
With above patch the fuzzer can collect the coverage over the shared memory and feed it into libFuzzer,
void pishi_collect()
{
  struct pishi *coverage = (struct pishi *)mc.ptr;
  for (int i = 0; i < coverage->kcov_pos; i++)
  {
    uint64_t pc = coverage->kcov_area[i];
    _pishi_libfuzzer_coverage[pc % sizeof(_pishi_libfuzzer_coverage)]++;
  }
}
Our KEXT resets the kcov_pos for the next iteration. libfuzzer also cleans its own counter with ClearExtraCounters function.
Let’s apply instrumentation to our sample fuzz_me function to see if the fuzzer works properly.
As you can see in the video, we will get a kernel panic in some seconds.
extern "C" int LLVMFuzzerTestOneInput(const uint8_t *data, size_t size)
{
  pishi_start(PISHI_SAMPLE);
  uintptr_t **a = (uintptr_t **)&data;
  ioctl(pishi_fd, PISHI_IOCTL_FUZZ, a);
  pishi_stop();
  pishi_collect();
  return 0;
}
As you see, each time libFuzzer finds a new BB, it increments ft:, i.e., the features described earlier.
Mission accomplished!
At this point we have setup everything, we just need to instrument com.apple.driver.AppleAVD and enjoy our coverage-guided fuzzing of AppleAVD.
is’t this cool?
LLVMFuzzerInitialize(int *argc, char ***argv)
{
  ...
  service = IOServiceGetMatchingService(kIOMainPortDefault, IOServiceMatching("AppleAVD"));
  IOServiceOpen(service, mach_task_self(), 0, &connect);
  ...
}

extern "C" int LLVMFuzzerTestOneInput(const uint8_t *data, size_t size)
{
  pishi_start(1);
  ....
  IOConnectCallMethod(
      connect, 1,
      NULL, 0,
      data, size,
      NULL, &output_scalars_count_result,
      output_structure, &output_structure_size_result);

  pishi_stop();
  pishi_collect();
  return 0;
}
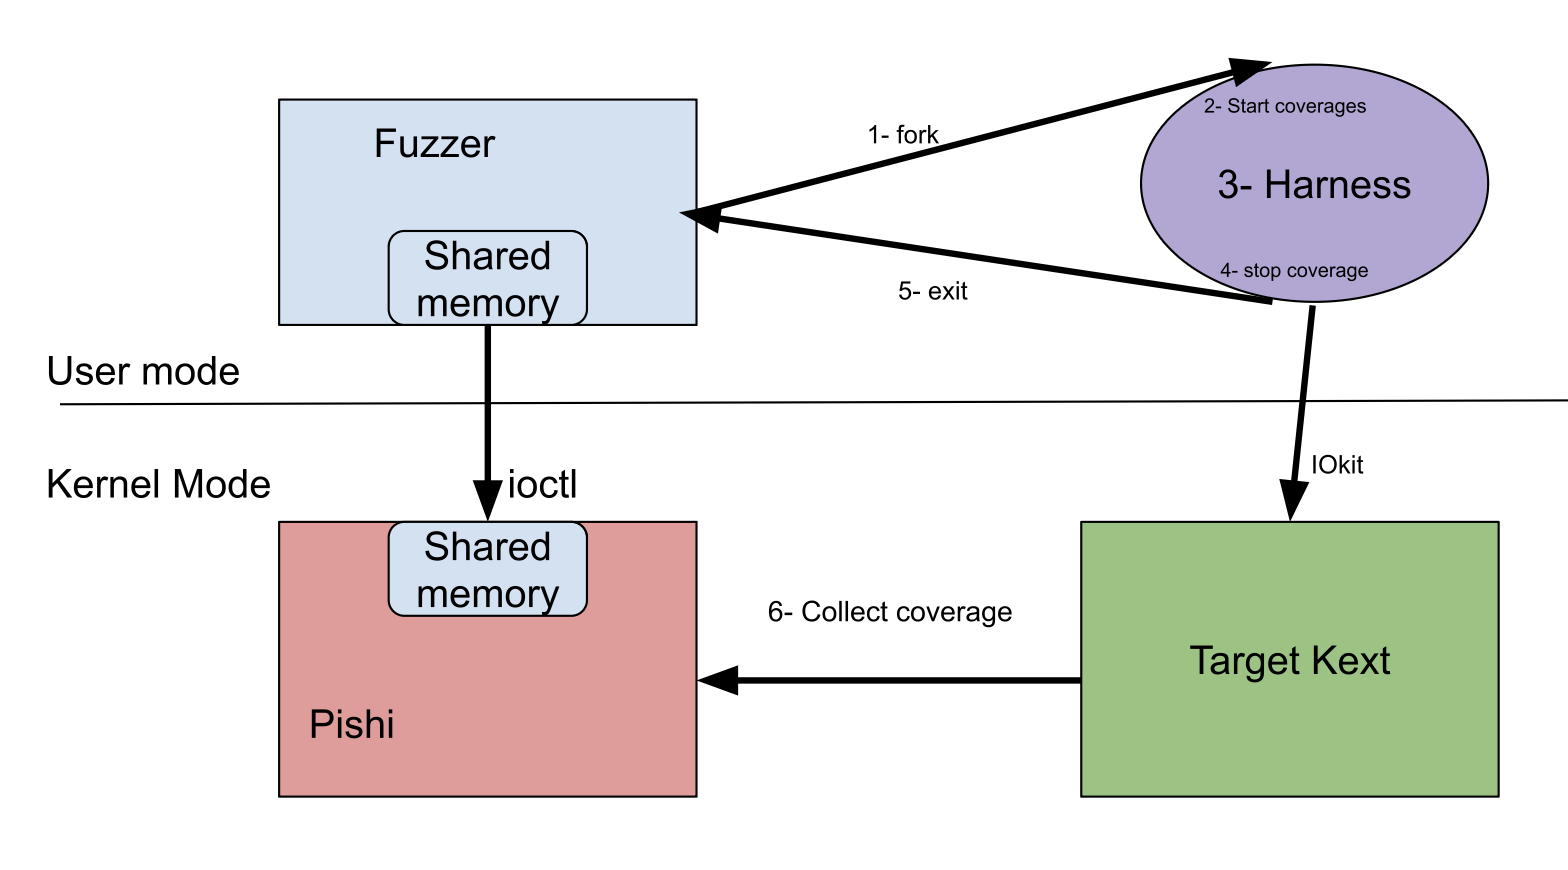
The final design
The final design of our fuzzer could be as follows, we will embed our KEXT into the Boot Kext Collection then instrument all basic blocks within the target KEXT in Boot Kext Collection.
Our KEXT will allocate and map a shared memory inside the fuzzer process.
in case of fuzzing stateless kerenl components, like a buffer or a memory parser, you can continus using In-memory Looping.
but in case of stateful APIs,
in each iteration fuzzer can fork a new harness inside libFuzzer’s LLVMFuzzerTestOneInput, the forked process will inherit our fd and the new generated input, then the child would enable coverage with the inherited fd for the current thread and after stop and exit, parnet would collect the coverage. so next fork would have a semi-fresh kernel state. otherwise each iteration would affect next one via leaked resoruces(fd, mach ports, memory, task,…) if you miss closing them, most of the resouces will be automatically closed when the process terminates, regardless of the reason for the process termination. but there could be some that outlive the process after termination.( for example allocated netfilter objects in Linux). syzkaller also has its own way of having a fresh state for each execution.
LLVMFuzzerTestOneInput(const uint8_t *data, size_t size)
{
  if (fork() == 0) {
    Pishi_start_coverage(1);
    do_fuzz(data, size)
    pishi_stop_coverage();
    // exit
  } else {
    wait(NULL);
    pishi_collect_coverage_in_parent();
  }
}
Performace and Benchmark
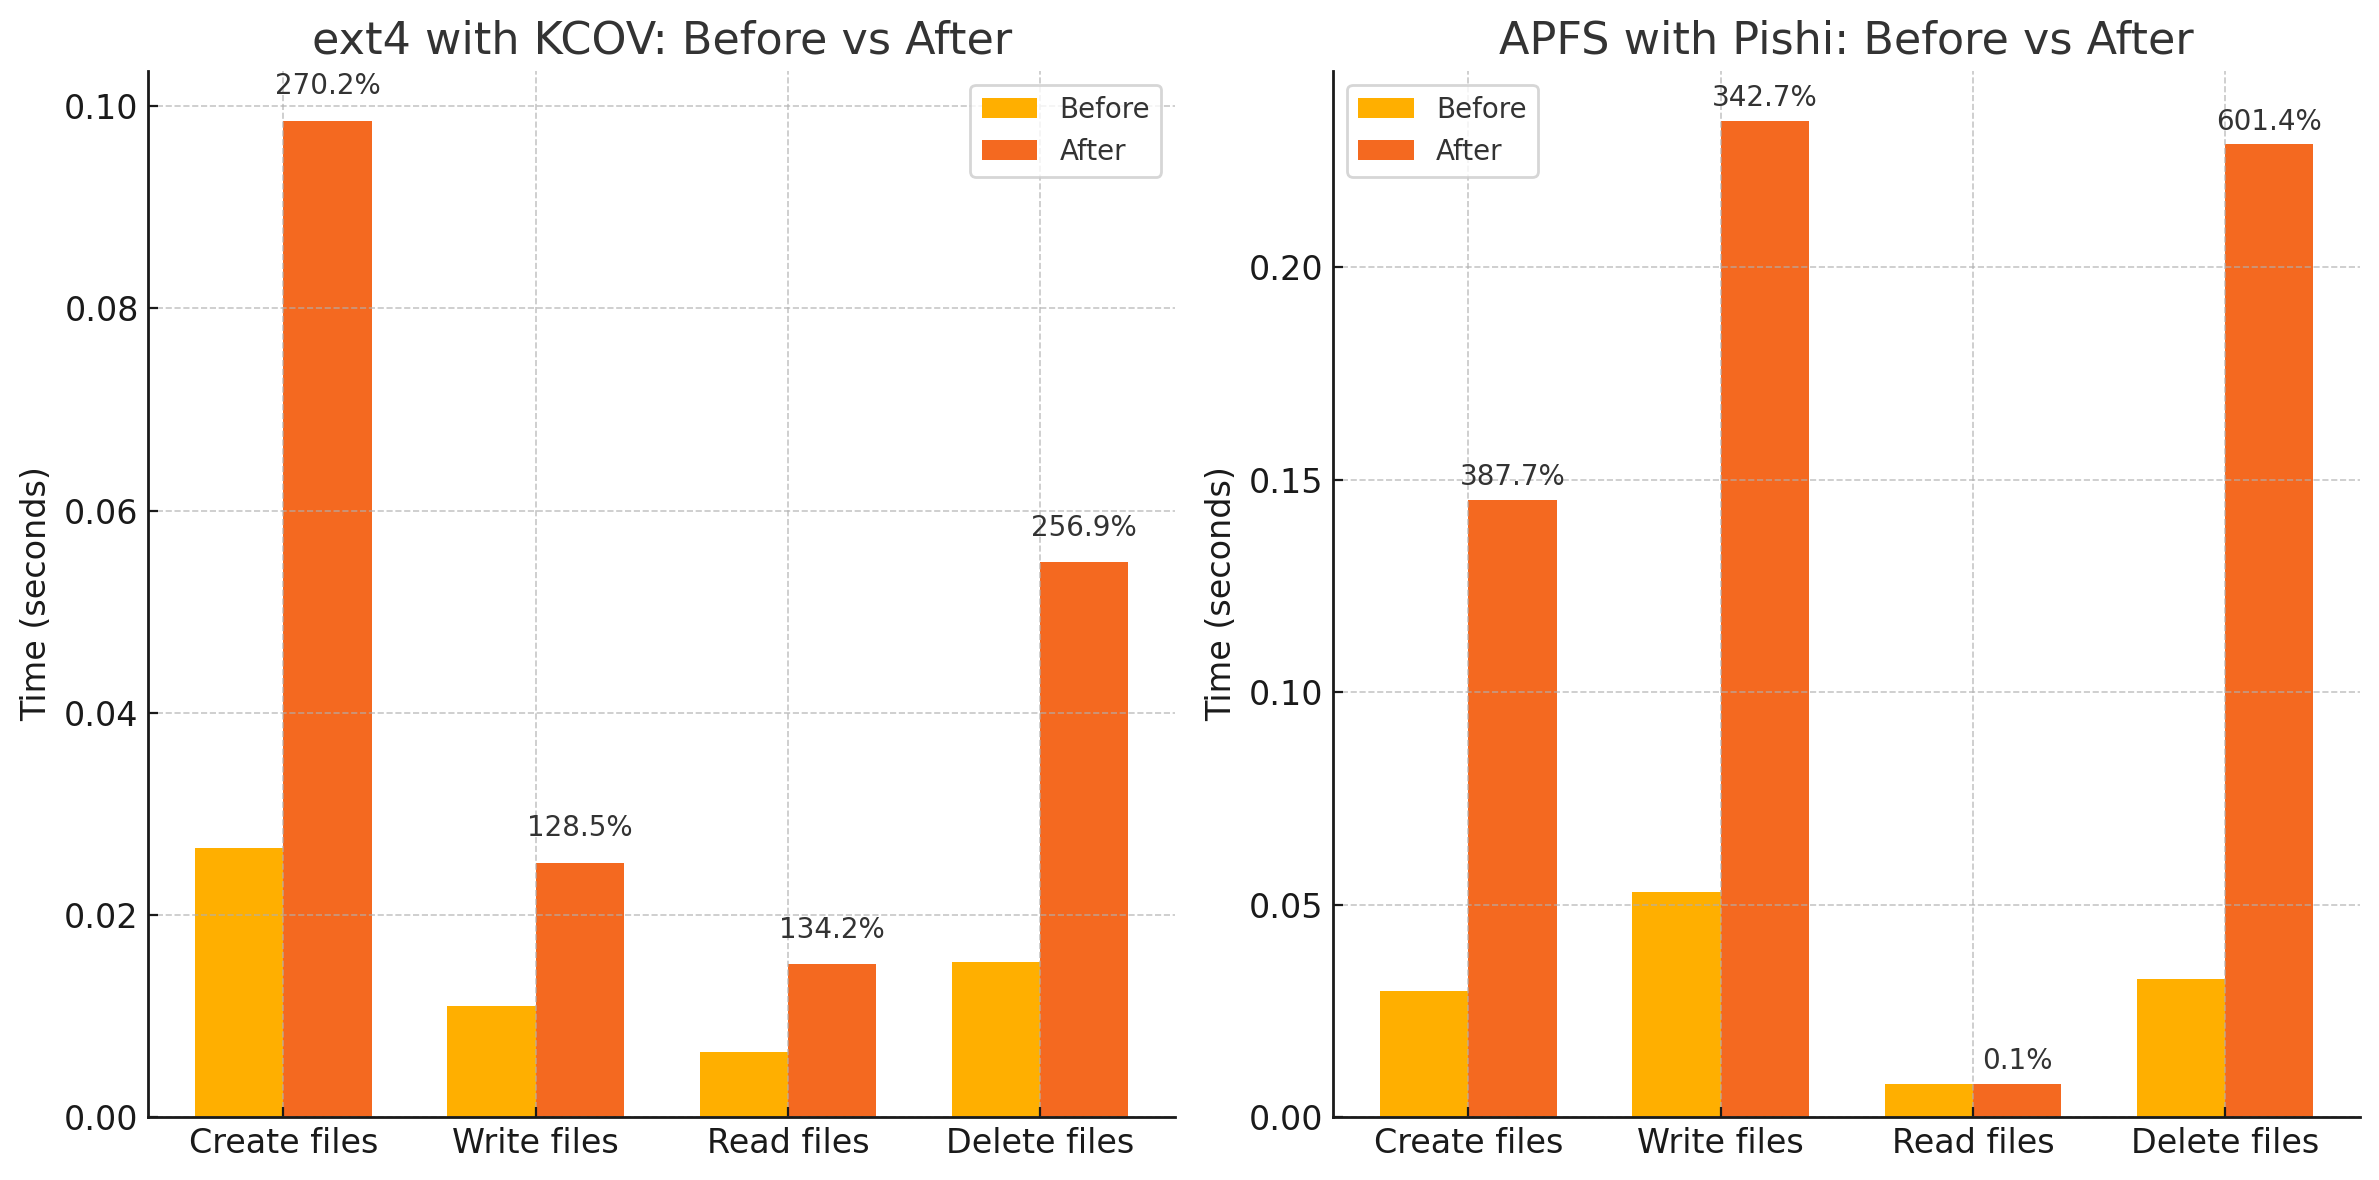
to have a very basic and straightforward understanding of performance degradation,
I instrumented com.apple.filesystems.apfs in macOS with Pishi and ext4 directoty of Linux kernel with KCOV and executed an IO/File system intensive program.
Saving some CPU cycles.
Despite having no tangible runtime overhead, with a little effort, we can embed _sanitizer_cov_trace_pc into trampoline, as well as optimizing _push_regs and _pop_regs away by saving and restoring only clobbered registers, we can save some unnecessary CPU cycles per instrumented BB.
How to instrument XNU?
Unlike KEXTs we can’t just enumerate all BBs in XNU kernel and instrumenting them. some functions can’t be instrumented e.g kcov-blacklist-arm64 and kcov-blacklist. I also found some more non-instrumentable functions in my tests.
So how can we filter these functions out?
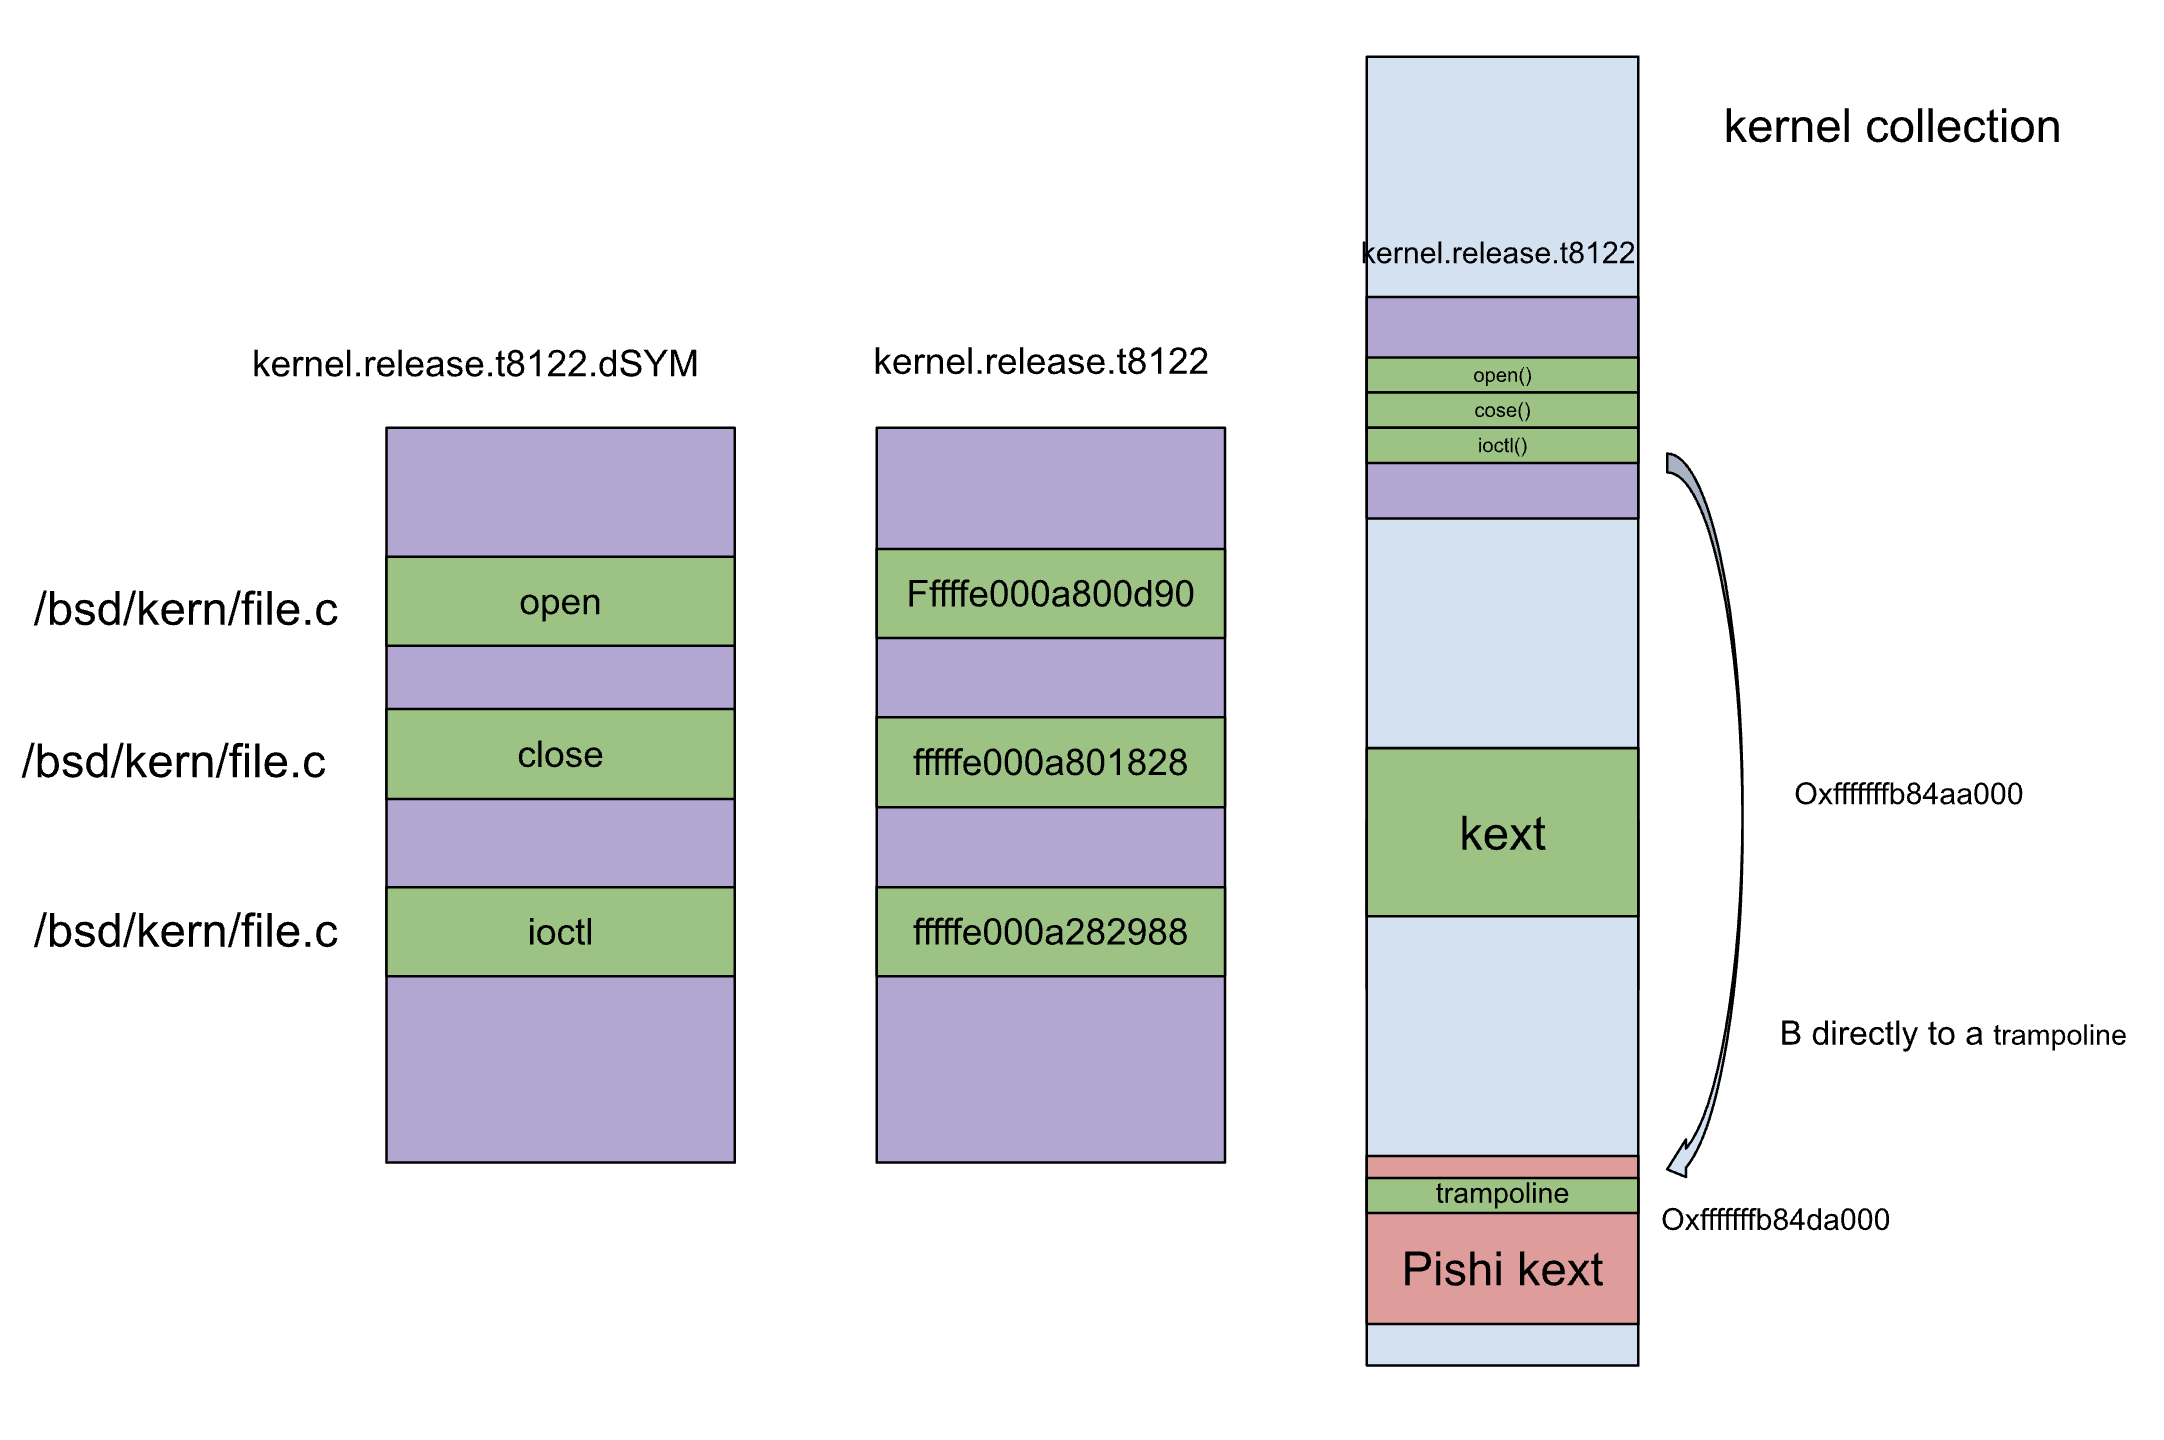
The XNU kernel binary is stripped of symbols and function names, except exported functions.
but kernels inside KDK come with DWARF file, and the offsets of kernel functions within the Boot Kext Collection and within the DWARF files are same.
therefore we can create [Function Name, Offset] pairs for the functions we want to instrument from the DWARF file, and then use this information to instrument intended targets within the Boot Kext Collection.
this is the point were you can target one path, a file or a function inside XNU soruce tree. as I told in the introduction.
Stateful fuzzing with libprotobuf-mutator
Another way to describe fuzzing is that we want to generated inputs for a target State Machine, in hope for a transition into an unintended state.
for stateful APIs the accepted inputs are valid sequance of APIs that each API or state transition remembers preceding states/context(opened fd, socket, handle,…) in case it has context dependency to the previous states. for example write system call has context dependency on open system call.
We can describes these APIs in Protobuf’s language, in this way we have a convenient way to serialize a instance of this structured data, and libprotobuf-mutator provides an easy way to mutate it.
As I told before, Pishi supports instrumenting XNU kernel. and we have made libFuzzer aware of Pishi, so nothing prevenst us to use libprotobuf-mutator to have Context-aware, structure-aware, feedback-aware XNU fuzzing similar to SockFuzzer. More info about libprotobuf-mutator.
for example, if we instrument the following directories, Mach IPC and VM subsystems of XNU with Pishi.
osfmk = [
    "/osfmk/ipc",
    "/osfmk/vm",
    "/osfmk/voucher",
]
We can then perform fuzzing using a protobuf similar to the one shown below.
// mach.proto
message Session {
  repeated Command commands1 = 1;
}
message Command {
  oneof command {
    MachPortNames machPortNames = 1; // API: mach_port_names
    // ....
    MachVmAllocate machvmallocate = 44; // API: mach_vm_allocate
  }}
Within just less than an hour, I managed to identify an unexploitable race condition deep inside mach_msg.
panic(cpu 1 caller 0xfffffe0015cbee28): PAC failure from kernel with DA key while authing x16 at pc 0xfffffe001549d268, lr 0x95bcfe001548e020 (saved state: 0xfffffe401e3af650)Booting macOS
I have tested the instrumented kernel on a real Macbook and Parallels Desktop, Starting with Parallels Desktop 18, it’s possible to boot into Recovery Mode.
Another option is use Virtualization.framework directly or via UTM, do you want to read two fantastic articles about it?
- Running Third Party Kernel Extensions on Virtualization Framework macOS Guest VMs
- Custom Boot Objects in Virtualization Framework macOS Guest VMs
The ability to boot an instrumented Boot Kext Collection a real MacBook enables you to fuzz KEXTs that are unavailable in a virtual machine environment.
libFuzzer, syzkaller, and more
I described using libFuzzer to fuzz stateless inputs like AppleAVD and AppleJPEGDriver. and libprotobuf-mutator to fuzz stateful APIs like XNU’s mach traps and system calls.
syzkaller is another popular fuzzer. you can fuzz the XNU kernel using syzkaller and Pishi. at the time of writing this blog, Pishi’s kernel module needs a slight change to be able to hook into syzkaller, but it’s just matter of changing some IOCTLs.
Finally, I have to emphasize again that Pishi is instrumneation tool you can hook it into any off-the-shelf fuzzer you like. including honggfuzz, AFL++ or LibAFL with some Rust magic, it’s easy to add custom instrumentation backends to LibAFL.
From now on, it’s simply a matter of implementing your harness for any target you choose.
Remote attack surfaces.
Pishi can be used to fuzz remote attack vectors such as the WiFi and Bluetooth stacks, as well as SMB, CIFS, and NFS, Similar to how “To Boldly Go Where No Fuzzer Has Gone Before” paper approached the topic.
As a basic test, instrument the com.apple.filesystems.smbfs module. Share a folder in a virtual machine and mount it externally. Then, execute a simple command like ls to observe the coverage results within the VM. with a slightly modified _sanitizer_cov_trace_pc you can view the coverage.
if we are fuzzing remote attack surfaces with VM and the fuzzer is running in the Host, then we need to share the coverage from Guest OS to Host OS. The only practical way is using shared memory.
Unfortunately, neither ivshmem nor virtIO-shmem is supported by the Virtualization.framework or QEMU (and thus UTM) on macOS. otherwise it would have been super easy to Inter-VM Shared Memory.
We will discuss this solution architect in detail later, but briefly, to have an efficient and real-time/low latency communication between the host and guest in QEMU. One solution is to use a custom PCI/PCIe device(VirtIO,…) to share a memory(again MMIO) backed by a shared memory in the Host, and mapping that memory(PCI BARs) inside the kernel or user mode of the Guest OS, unfortunately we don’t have a luxury of Linux to simply mapping BARs via \dev\mem in macOS. you have to set kmem=1 in your boot-args on DEBUG kernel, in case of using release build, we need to have a PCI side inside our Pishi KEXT.
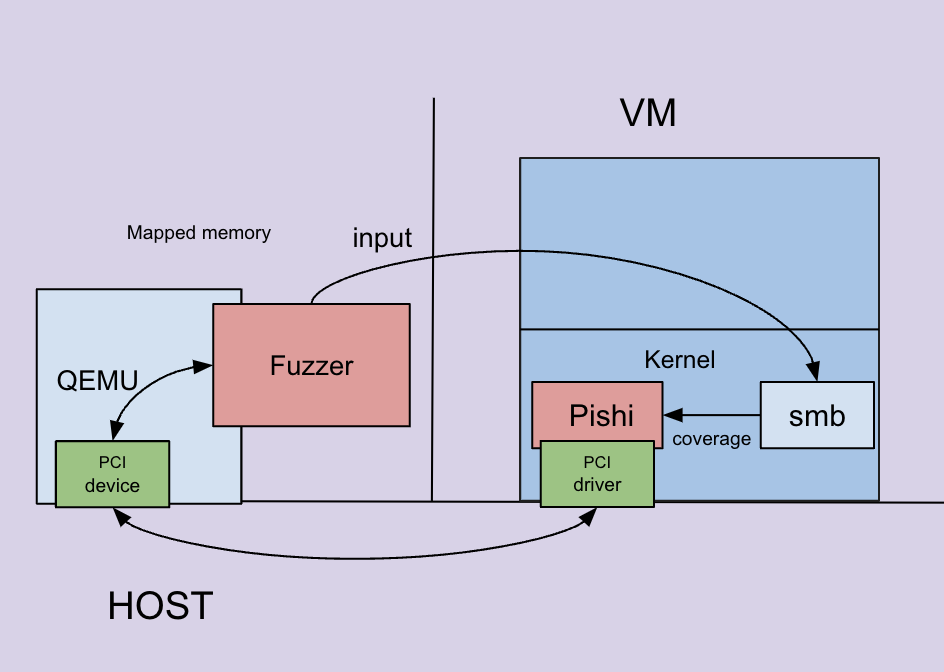
This enables us not only to collect coverage but also to interact with the potential an agent inside.
We might be able to locally mount the SMB and run the harness there, without needing to share the coverage outside. but using VM is more generic way.
Another approach?
I was considering an alternative approach If everything had failed, the well known method of replacing each BB of a target KEXT with a breakpoint or an illegal instruction, then boot a Boot Kext Collection with modified EL1 exception handler in XNU that would log and restore every trapped BBs.
MacRootKit is also another (very good) promising way, it’s trying to boot XNU with hypervisor.framework, and with it’s own hypervisor it can have full control over the system. it’s still a work in progress, to be able to boot XNU.
Hyperpom, a cool Rust project, is a good example of using a hypervisor.framework to collect code coverage.
This project also uses breakpoints to trap into the EL2, As you can see in the excerpt of their ASCII art.
  Original instructions           Hooked instructions
  +----------------------+        +----------------------+
  | 0x00: mov x0, 0x42   |        | 0x00: mov x0, 0x42   |
  | 0x04: mov x1, 0x43   |------->| 0x04: brk #0  --------------> executes handler
  | 0x08: add x0, x0, x1 |        | 0x08: add x0, x0, x1 |        for address 0x04
  | 0x0c: ret            |        | 0x0c: ret            |
  +----------------------+        +----------------------+
Even though Hyperpom is not capable of loading a simple Mach-O file, let alone booting XNU or instrumenting KEXTs, its heavily commented source code is definitely worth reading. Hyperpom can only map a shellcode that has zero trappable instructions or sytem calls e.g. MSR, MRS, SVC,… into a VM memory and execute it, which is a significant barrier to fuzzing real targets. To be able to execute a Mach-O file, you need to map the dyld shared cache, trap system calls and probably a lot more.
I want to mention that using breakpoints is slower than the binary patching method I used in Pishi. Taking and handling an exception, then returning from it, causes some overhead.
We may also be able to modify QEMU to handle breakpoints while booting XNU with UTM to collect coverage instead of writing the hypervisor from scratch.
I also had some thoughts about using M1N1 to instrument kernel and KEXTs, Similar to the modified XNU exception handler, M1N1 also allows you to instrument KEXTs that are not available in a VM environment, such as AppleAVD.
As a last resort I could also implement the instrumentation part in the KEXT to find BBs and patch addresses at runtime similar to MacRootKit. However, one thread may attempt to execute an address while we want to instrument it. especially in the time window of instrumenting ten thousand BBs, This race condition is challenging, it requires suspending all threads and disabling preemption.
Additional features and optimizations.
Current user-mode binary instrumentation options in macOS, such as TinyInst, Hyperpom, Frida( Even though you can easily customize Frida, and I have used it many times similar to how seemoo-lab has fuzzed bluetoothd.) and QBDI, primarily support scenarios where a library can be loaded in a harness to call target functions. However, these options do not support fuzzing attack vectors located deep within a XPC or launchd daemon/agent executable file, since fuzzers cannot directly spawn these processes (only launchd can do that) to send input and collect coverage in a loop. In the next blog post, I will attempt to implement coverage-guided fuzzing for these specific targets.
I will also discuss additional features like.
- Supporting snapshot.
- Data flow coverage.
- Binary level Address Sanitizer.
- Sharing coverage from Guest OS to Host OS(Remote attack surfaces).
Also lengthy discussing about other coverage metrics and optimizations in instrumentation with Static Analysis, Data Flow Analysis (e.g Disposable Probes, Dominator Tree).
Further Resources on Optimizations
- Efficient Binary-Level Coverage Analysis
- Safer: Efficient and Error-Tolerant Binary Instrumentation
- Fine-grained Code Coverage Measurement in Automated Black-box Android Testing
- Using SMT Solving for the Lookup of Infeasible Paths in Binary Programs
- Optimizing Customized Program Coverage
- Deriving Code Coverage Information from Profiling Data Recorded for a Trace-based Just-in-time Compiler
- Post-silicon code coverage for multiprocessor system-on-chip designs
- A new method of test data generation for branch coverage in software testing based on EPDG and genetic algorithm
- Model-based performance analysis using block coverage measurements
- Efficient Coverage Testing Using Global Dominator Graphs
- Techniques For Efficient Binary-Level Coverage Analysis
- Dominators, Super Blocks, and Program Coverage
I also highly recommend to watch and read following resources to have a solid understanding discussed topics (BB, Edge, Path coverage,…).
- SanitizerCoverage
- Fuzzing Like A Caveman
- AFL technical paper
- Understanding and Improving Coverage Tracking with AFL++
- Knowing the UnFuzzed and Finding Bugs with Coverage Analysis - Mark Griffin (Shmoocon 2020)
- PathAFL: Path-Coverage Assisted Fuzzing
- ENZZ: Effective N-gram coverage assisted fuzzing with nearest neighboring branch estimation
- Predictive Context-sensitive Fuzzing
- lafintel
- Making Software Dumberer by Tavis Ormandy. despite being 14 years old, it remains the best and most comprehensive presentation on fuzzing.
- Compare coverage for AFL++ QEMU
- Data Flow Sensitive Fuzzing
- Circumventing Fuzzing Roadblocks
- Mateusz Jurczyk’s CompareCoverage
- datAFLow and its paper and video
- Brandon Falk, Advanced Fuzzing: Compare shattering
- Be Sensitive and Collaborative: Analyzing Impact of Coverage Metrics in Greybox Fuzzing
- BEACON : Directed Grey-Box Fuzzing with Provable Path Pruning
- Directed Greybox Fuzzing
- Registered Report: DATAFLOW Towards a Data-Flow-Guided Fuzzer
You can also find numerous valuable articles in https://wcventure.github.io/FuzzingPaper